Create a Metric Alarms
A metric alarm watches a single CloudWatch metric or the result of a math expression based on CloudWatch metrics. The alarm performs one or more actions based on the value of the metric or expression relative to a threshold over a number of time periods. The action can be an Amazon EC2 action, an Amazon EC2 Auto Scaling action, or a notification sent to an Amazon SNS topic.
Creating a Metric Alarm
Go to your CloudWatch Alarms Console.
- Click on Create Alarm.
- Click Select Metric.
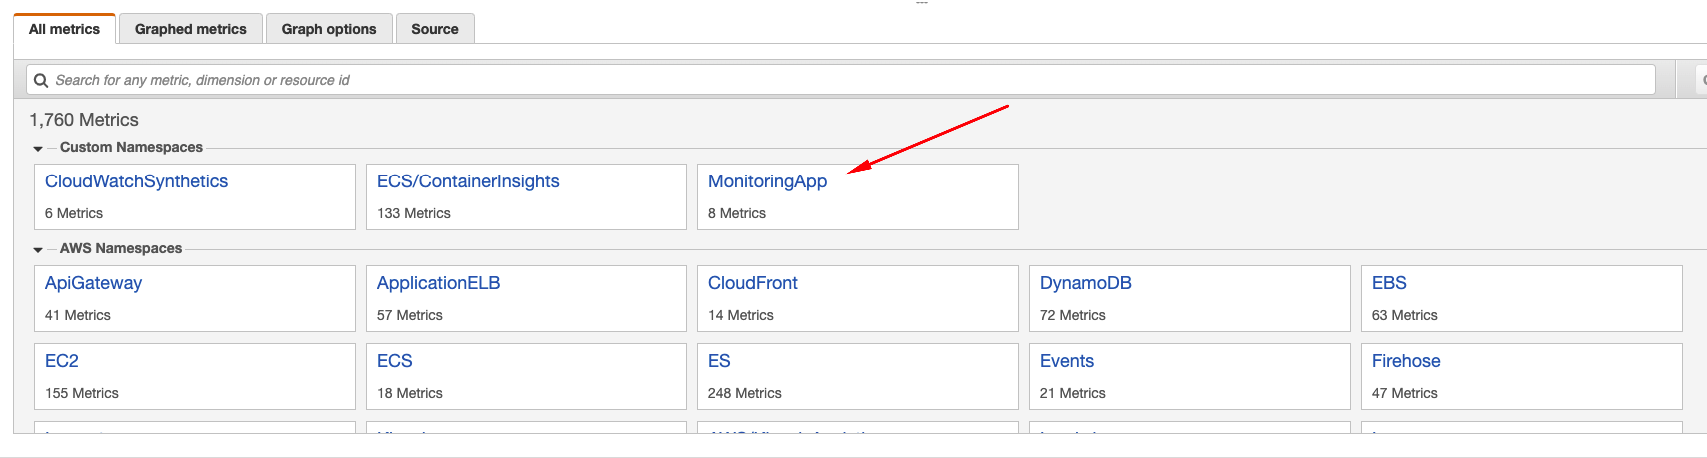
- This will take you to the Metrics home page, where you will see all the Namespaces available in the account. Select the
MonitoringAppnamespace
- Select
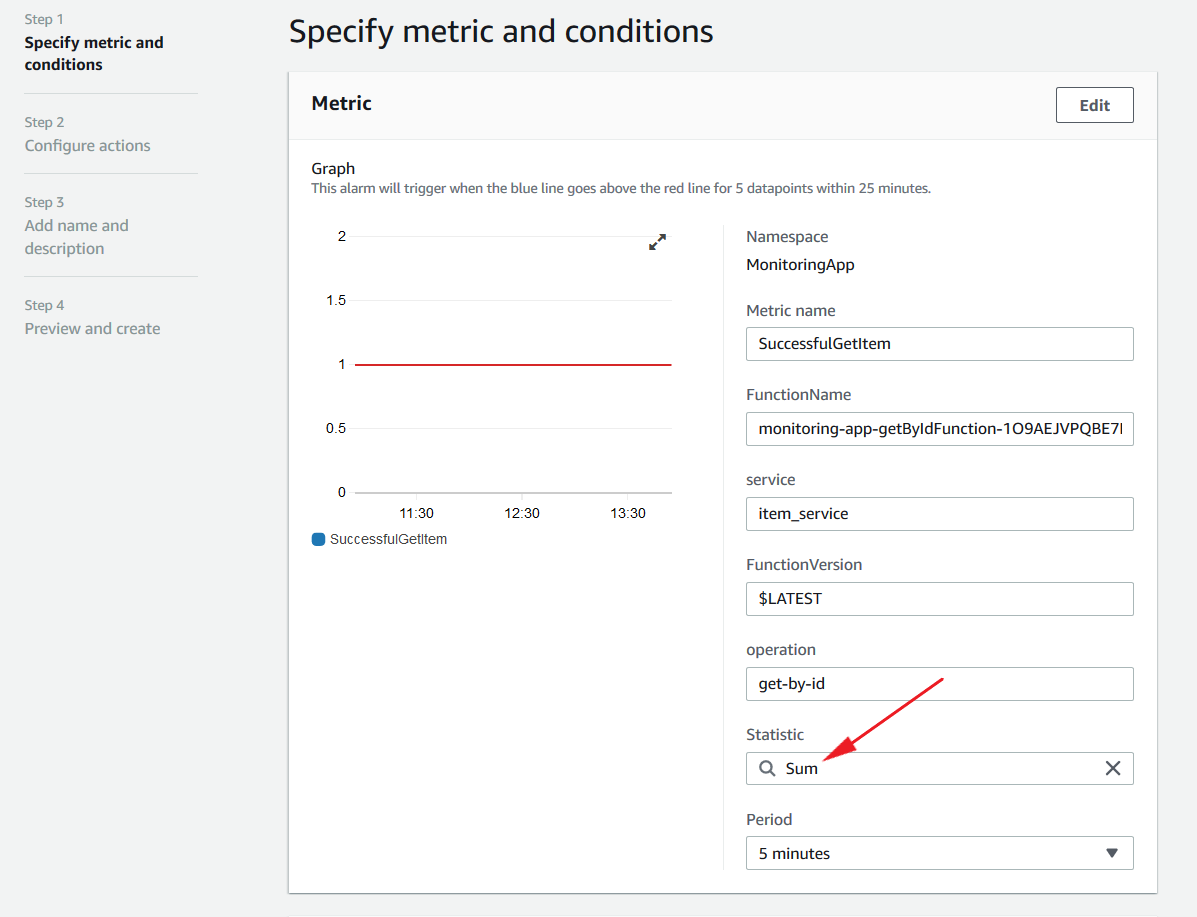
FunctionName, FunctionVersion, operation, servicedimension and select theSuccessfulGetItemmetric we created in the previous exercise.

-
Enter the threshold value (for example, 1) that you want the metric data to be monitored. Notice that Static option is selected by default, which means we will be setting a static value as the threshold to be monitored.
-
Expand Additional configuration where you can indicate how many occurences of the breach qualifies for the alarm to be triggered. Set the values to 1 out of 5, which will make the alarm get triggered if there has been 1 breaches in 5 evaluation periods. Notice the message at the top of the graph describing the setting as This alarm will trigger when the blue line goes above the red line for 1 datapoints within 25 minutes.
-
Click Next.
-
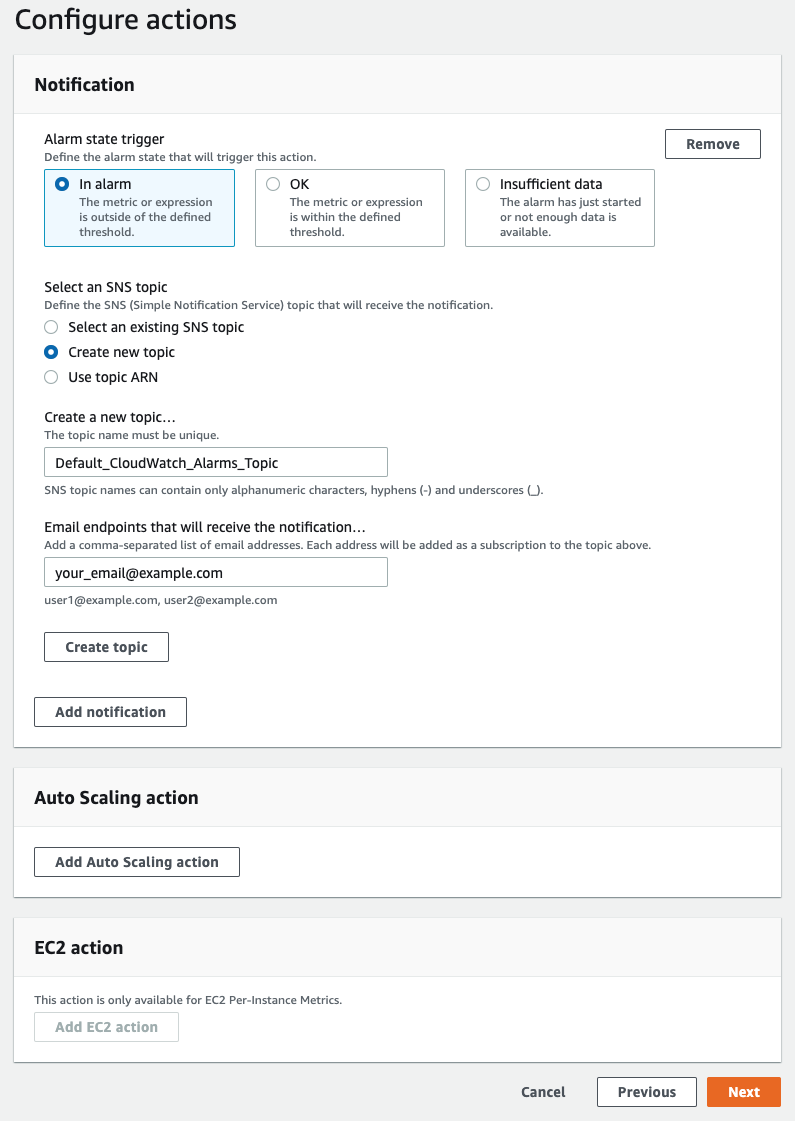
In the Configure actions screen, you can set what action you want to take when the alarm changes to different states such as
In alarmOKInsufficient data
The available options for actions include, - Send a notification to an SNS topic - Take an Auto scaling action - EC2 action if the metric is from an EC2 instance
- Select Create a new topic to create a new SNS topic to send the notification to and provide your email address.
- Name it
my_observability_topic, fill youre-mail addressand click Create topic. - Click Next.
- Name it
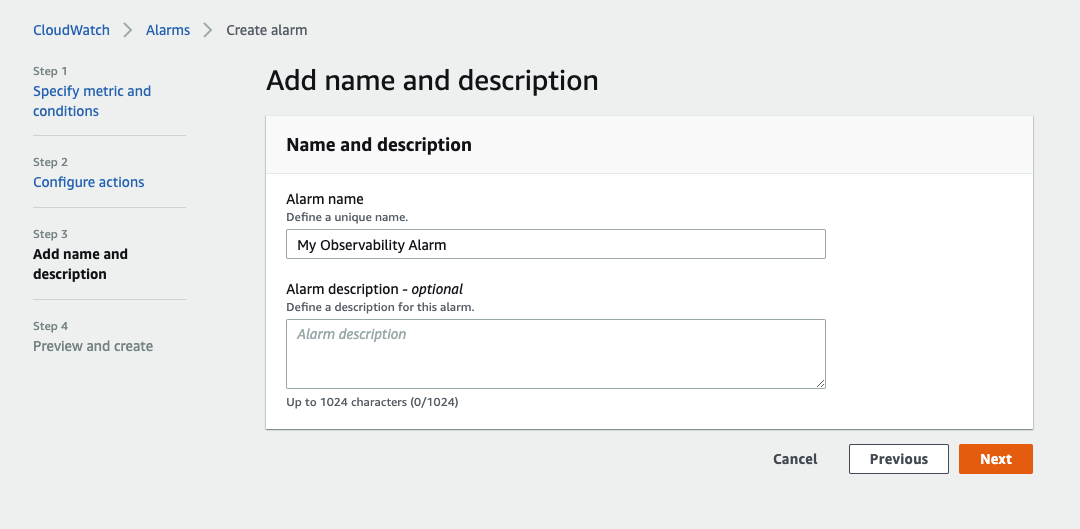
My Observability Alarm. - Click Next.
- Review your settings and click Create alarm.
- Open you e-mail inbox and confirm your SNS topic subscription
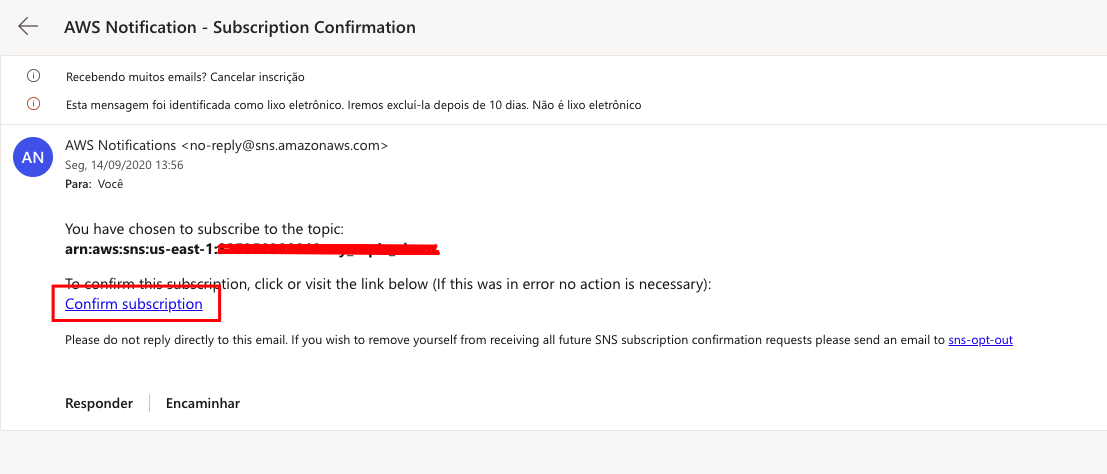
If you don’t confirm your e-mail subscription, you will not receive any notification emails for triggered alarms. Always remember to also check your spam folder.