Validate Metrics in the Console
Validate EMF Output in CloudWatch Logs
-
Go to your CloudWatch Console.
-
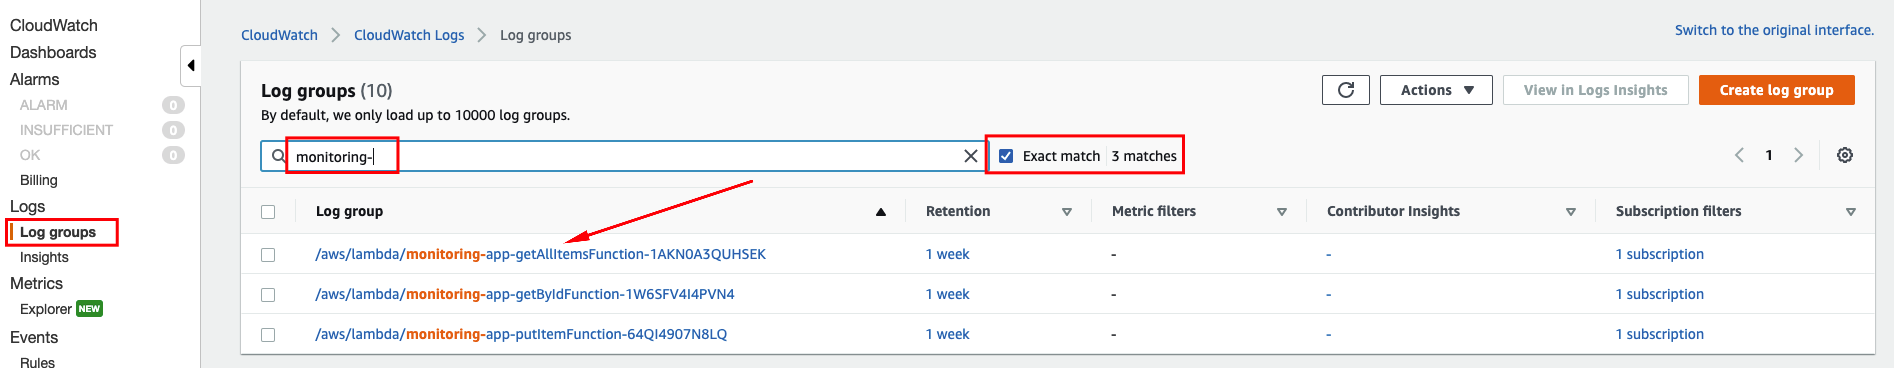
Under Logs, click Log Groups.
-
Check the Exact match box, and type the prefix of your Stack, monitoring-app in our case.
-
You should see all available Log Groups for our Lambda functions.
-
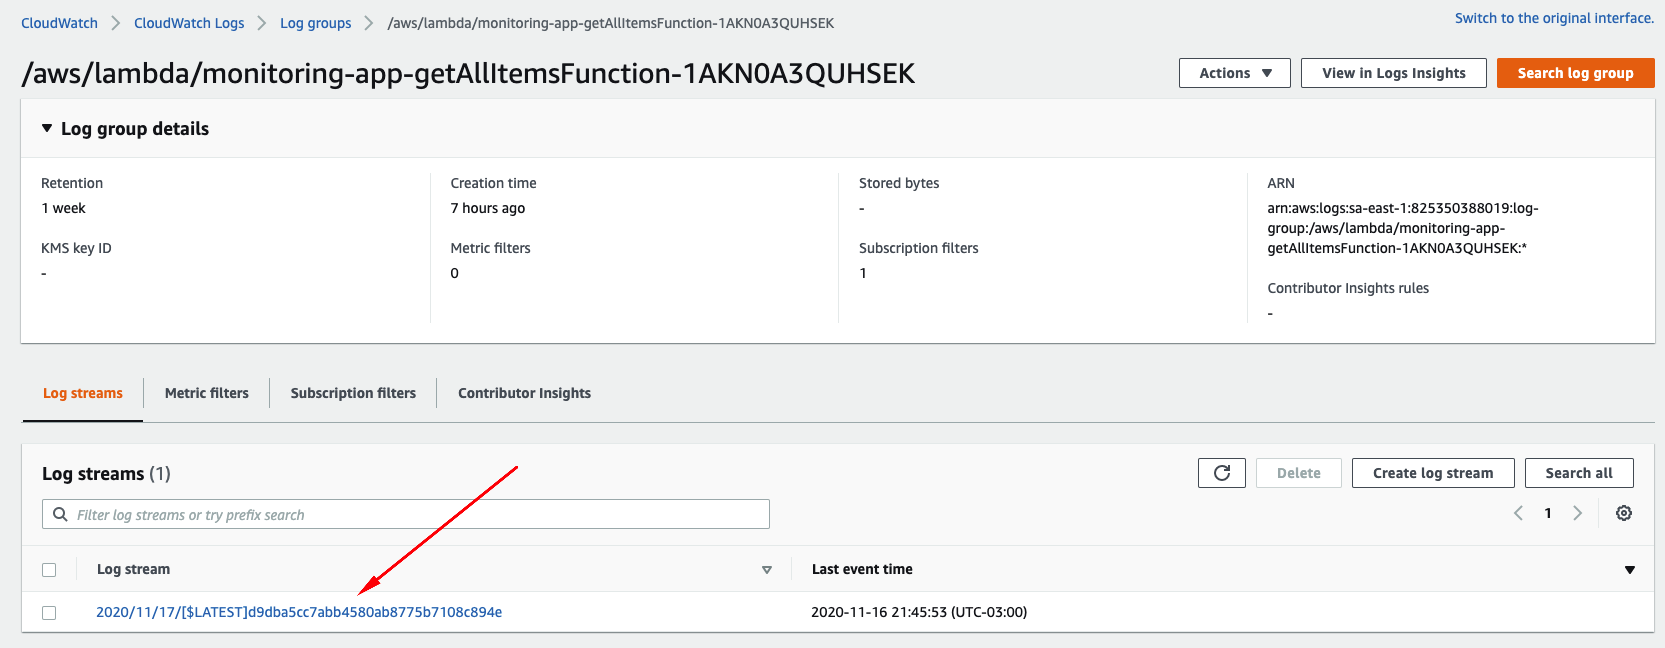
Click in the one that contains GetAllItemsFunction on its name.
-
Click in the latest Log Stream.
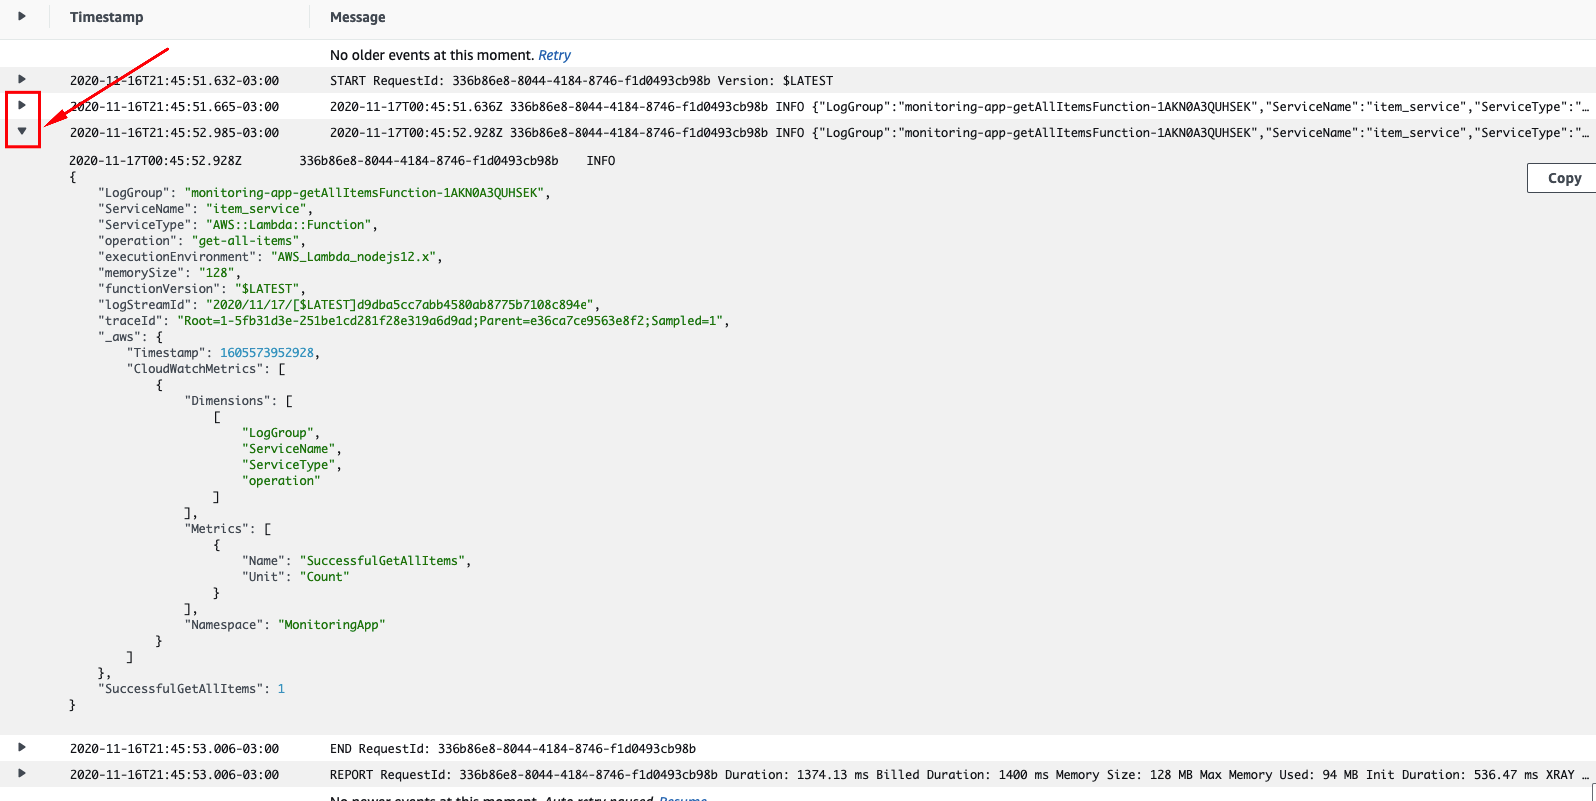
You should be able to see something like the print screen below containing at least three log entries: Two for the context and event objects, a tentative error log in case of any failures, and a final one regarding the result of the function execution.
-
Expand and navigate through the payload generated for each entry. Notice that the additional metadata that we added in our helper lib are present for each entry.
Validate Metrics in CloudWatch Metrics
-
Go to your CloudWatch Console.
-
Click Metrics.
-
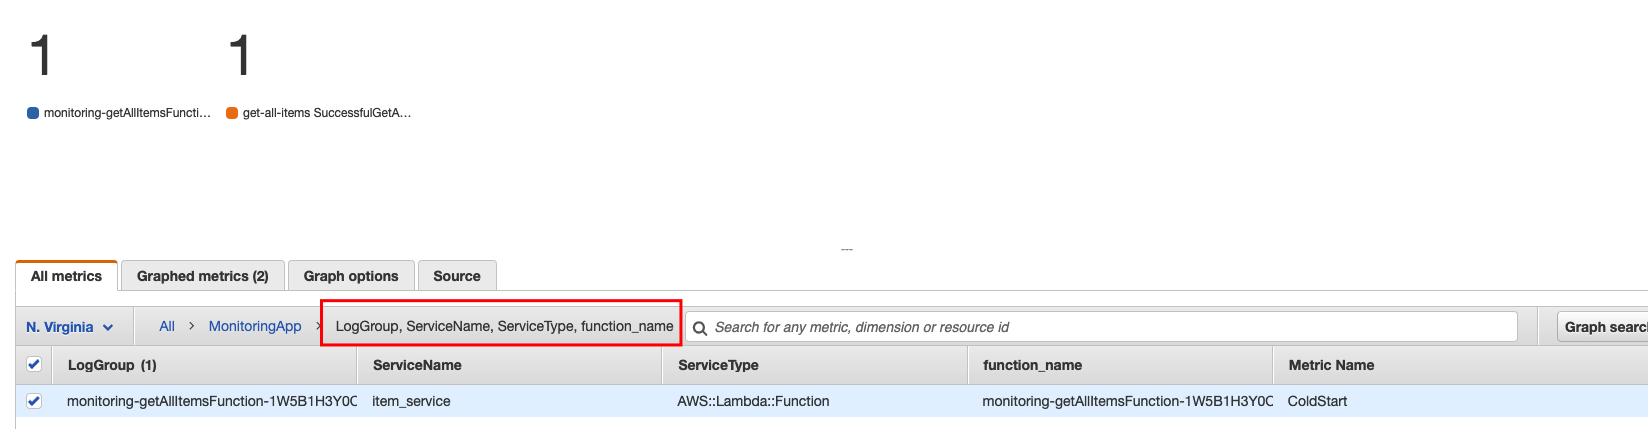
On Custom Namespaces, click the
MonitoringAppnamespace. -
You should see a new metrics dimensions:
LogGroup,ServiceName,ServiceType,function_name. -
Click it and select all metrics available.
-
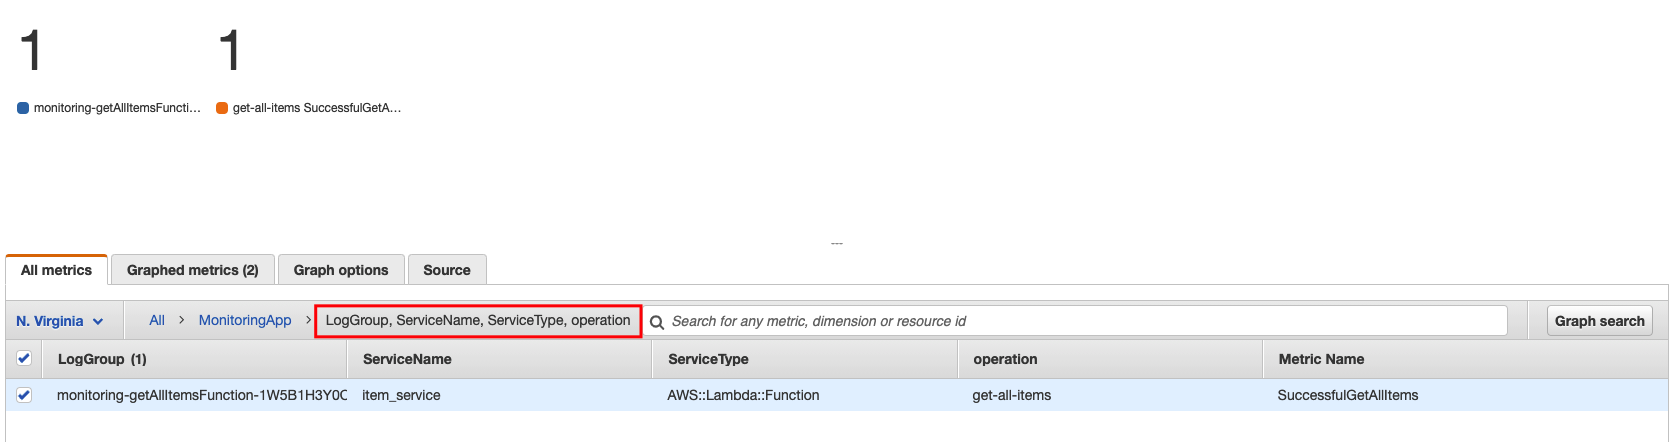
Go back to the
MonitoringAppnamespace. -
You should see another new metrics dimensions:
LogGroup,ServiceName,ServiceType,operation. -
Click it and select all metrics available.
-
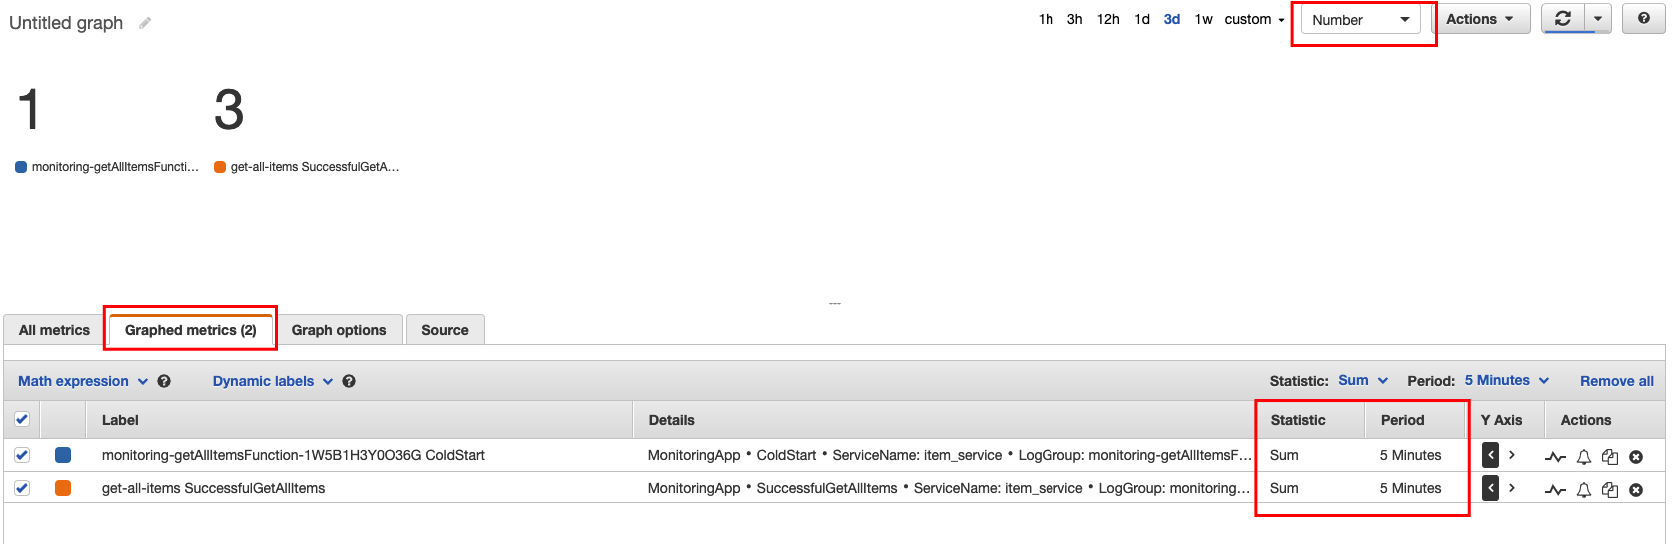
Click the Graphed Metrics tab and select all metrics available.
-
Validate the metrics you just selected.