Create a Dashboard
To demonstrate ways you can automate and create flexible and reusable dashboards, we will be deploying a CDK template to create our dashboards based on the previously created metrics for our sample app.
Deploy the CDK Dashboard Template
Go back to your Cloud9 environment and open a new terminal.
Optional - If you find yourself unable to run npm install or cdk deploy due a no space left on device error, you might want to free up some space.
# Look for uninstallable node_modules in our workspace to free disk space
find ~/environment -type d -name 'node_modules' -prune | xargs rm -r
Then, install, build and deploy the application
# Install, Build and Deploy the application
cd ~/environment/serverless-observability-workshop/code/cloudwatch-cdk
npm outdated
npm update --force
npm install --force
npm install -g typescript aws-cdk
cdk deploy -c stack_name=monitoring-app
Spare a couple of minutes to understand how these two SAR apps are being deployed by examining the SAM Template on serverless-observability-workshop/code/cloudwatch-cdk/lib/cloudwatch-cdk-stack.ts file.
Go to your CloudWatch Dashboard Console.
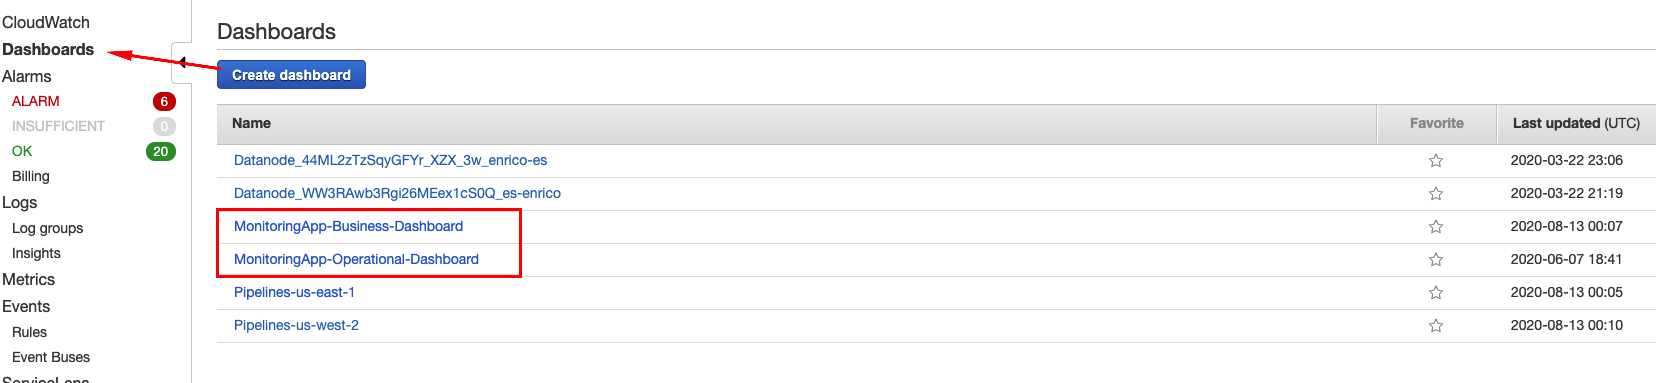
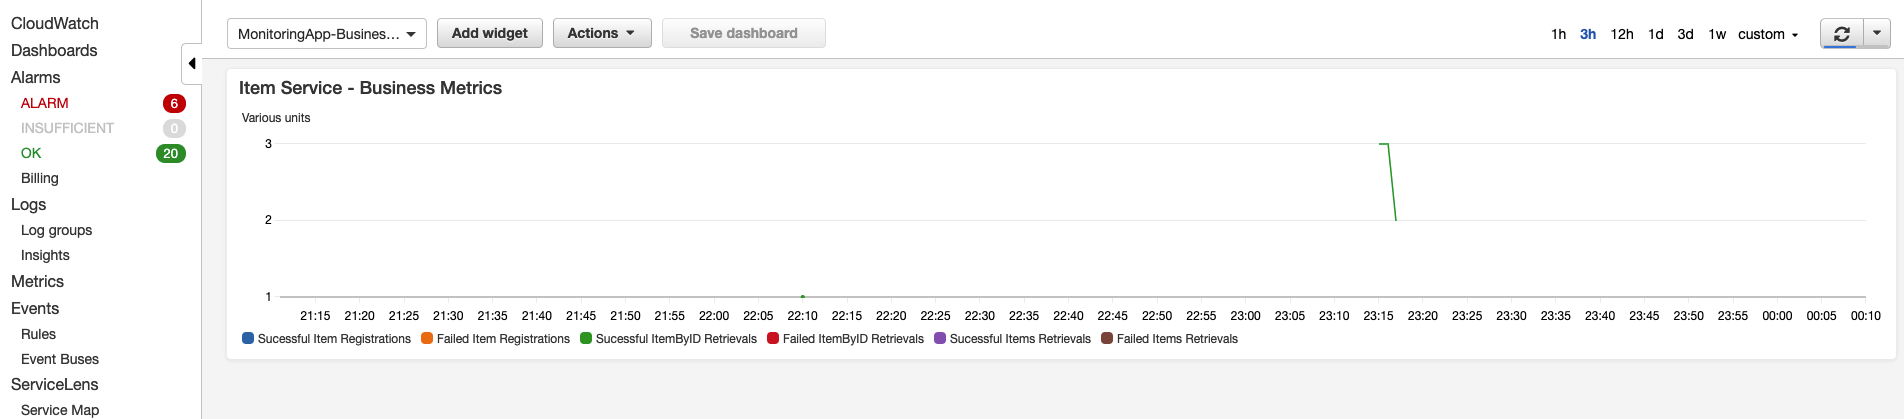
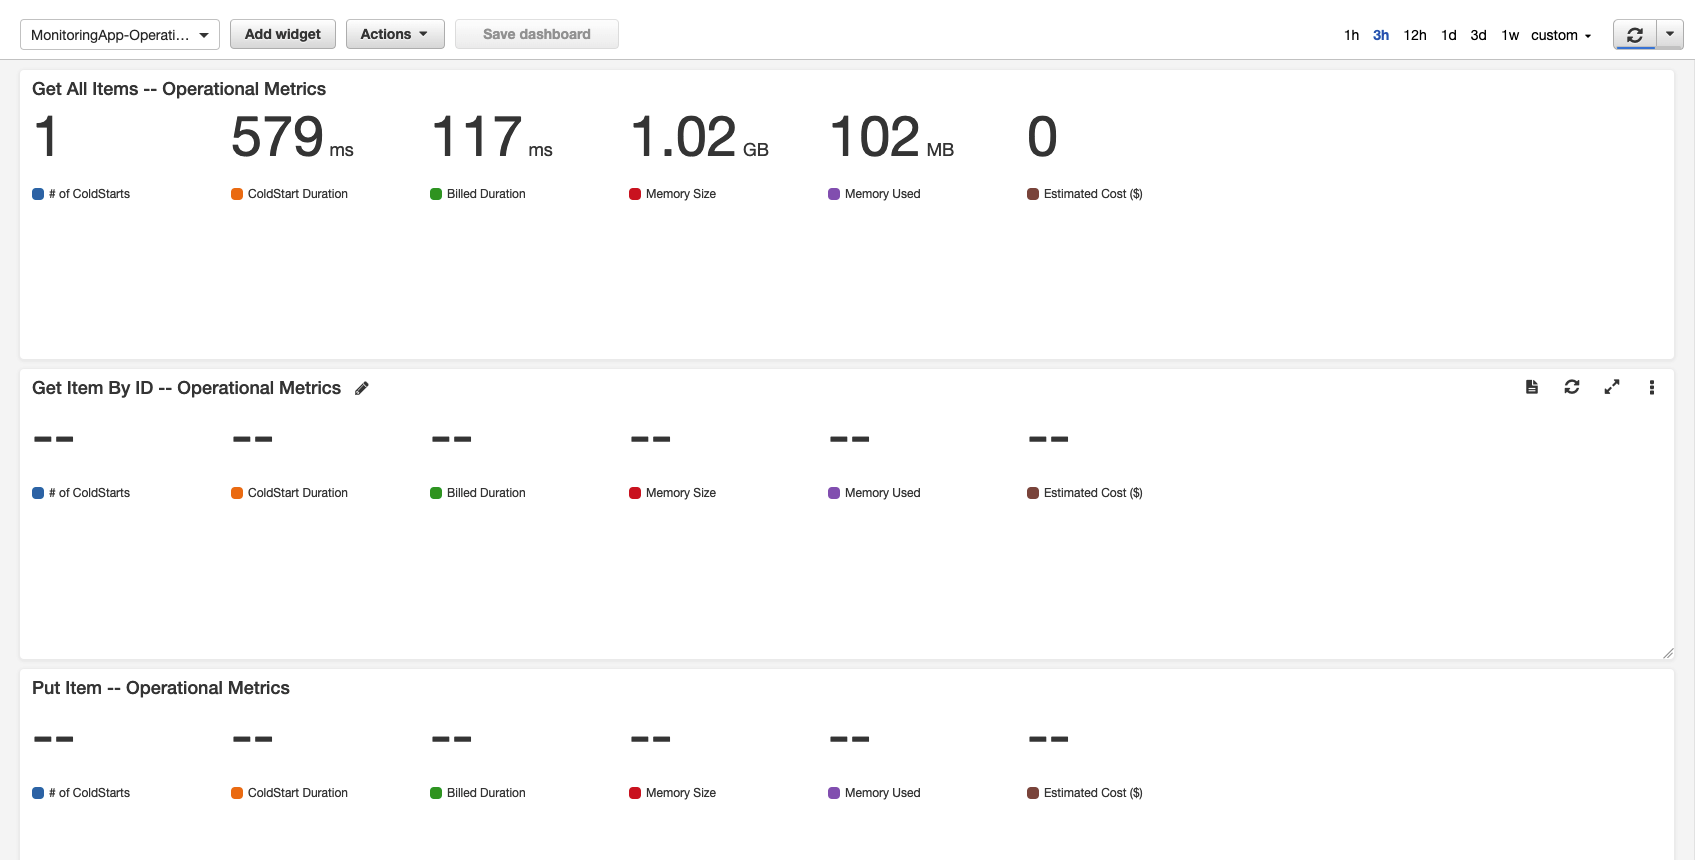
This CDK project creates two dashboards based on several widgets with different representations (Lines and Numbers) to demonstrate the different possibilities one can monitor its application health.
One Operational Dashboard for SysOps-related metrics.
And also a Business Dashboard for keeping up with business-related metrics.