AWS Serverless Observability Workshop > Metrics and Dashboards > Pushing Metrics Synchronously > Validate Metrics in the Console
Validate Metrics in the Console
Go to your CloudWatch Console.
-
Click Metrics.
-
On Custom Namespaces, select the
MonitoringAppnamespace. -
You should see metrics by two different dimensions:
function_name, serviceandoperation, service.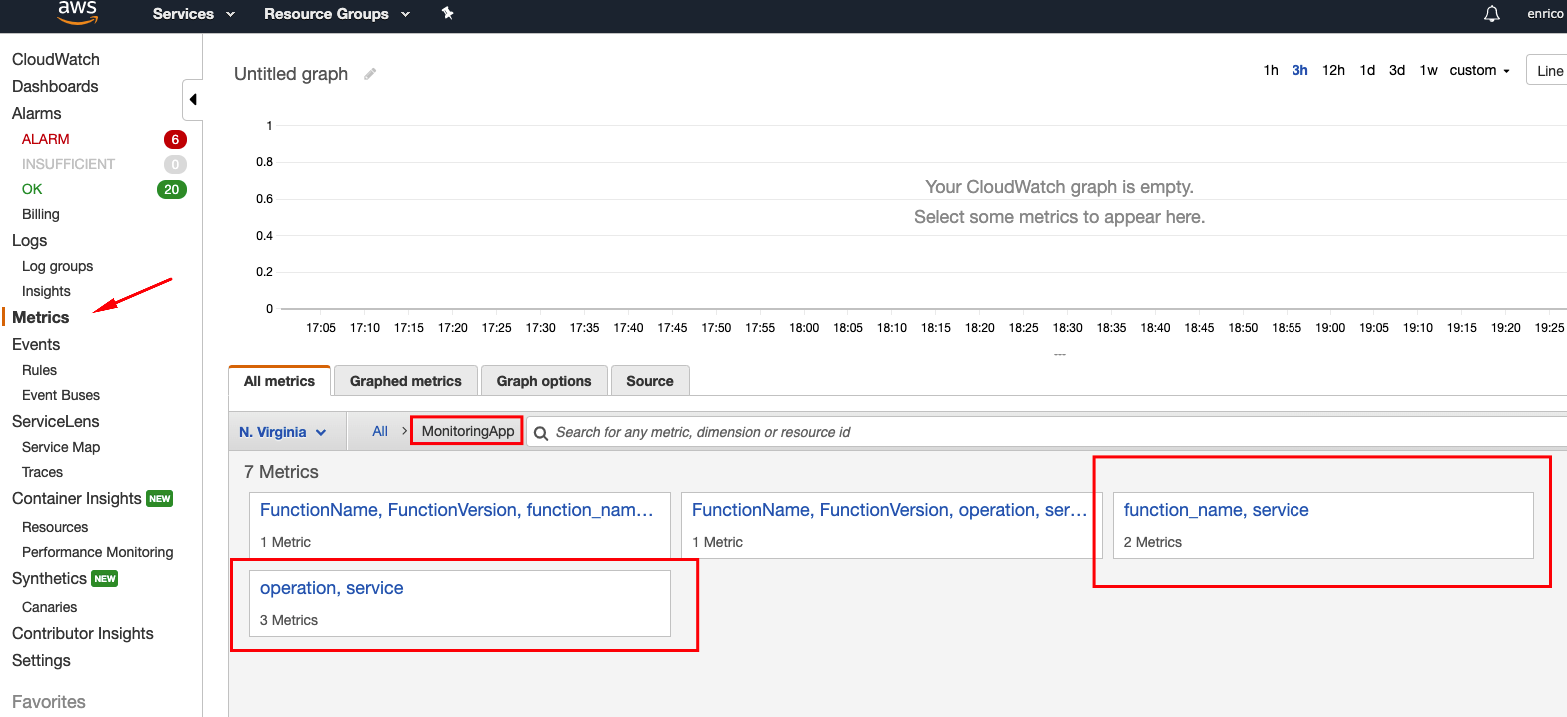
-
Click the function_name, service dimension and select all metrics available.
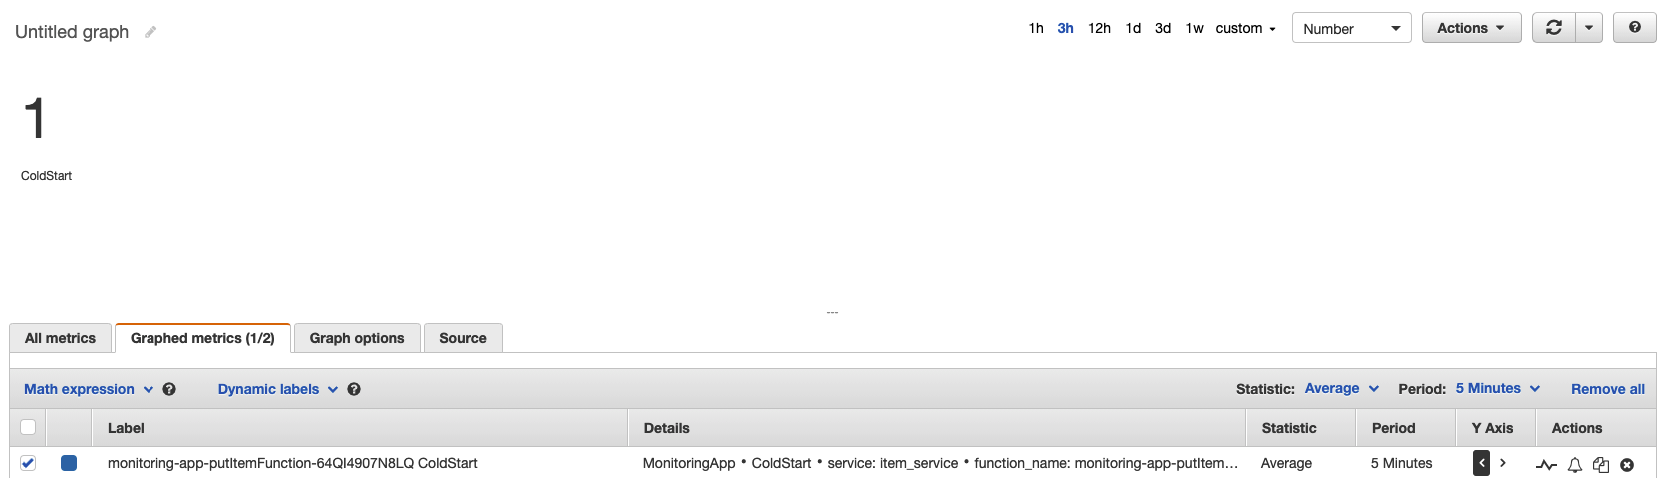
-
Go back to the
MonitoringAppnamespace. -
Click the operation, service dimension and select all metrics available.
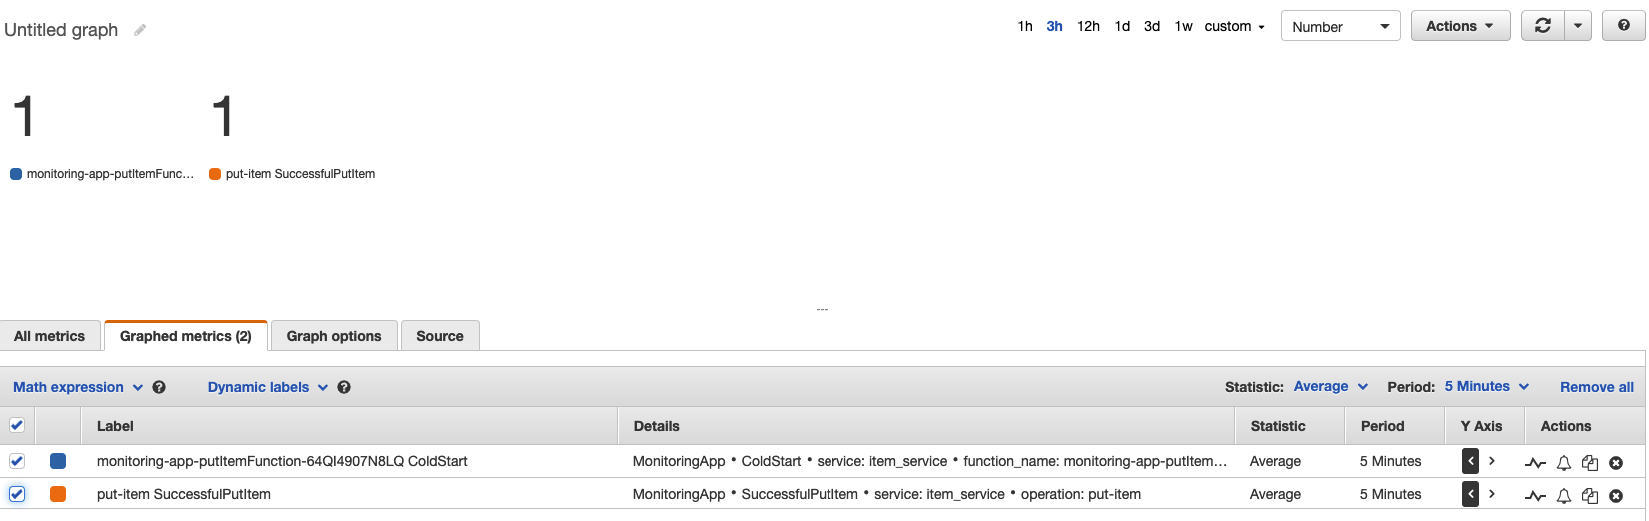
-
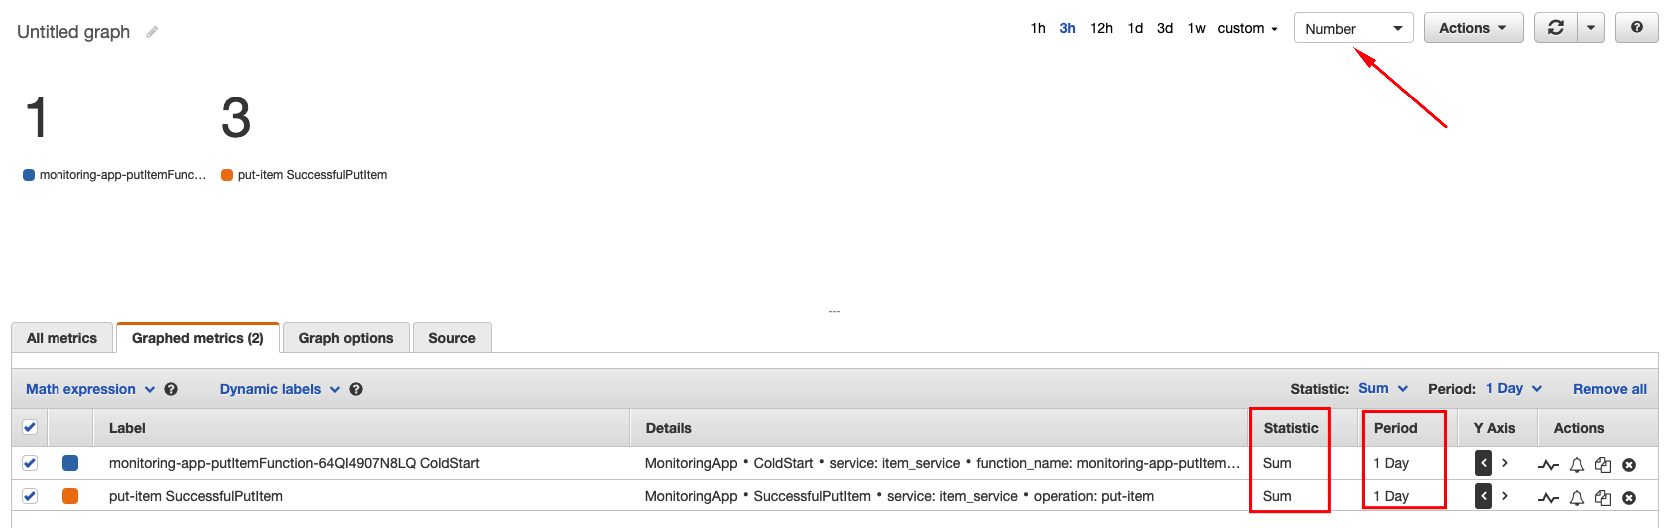
Click the Graphed Metrics tab.
-
Set the metrics exhibition type to
Number. -
Set the Statistic aggregation to
Sum. -
Set the Period to
1 Day. -
Validate the metrics you just pushed.