Querying Logs
Using Logs Insights queries
Go to CloudWatch Logs Insights console and select the /aws/lambda/monitoring-app-getAllItemsFunction log group. Remember, you can select more than one log group if needed. As of Aug 2020, you can select up to 20 log groups at a time.
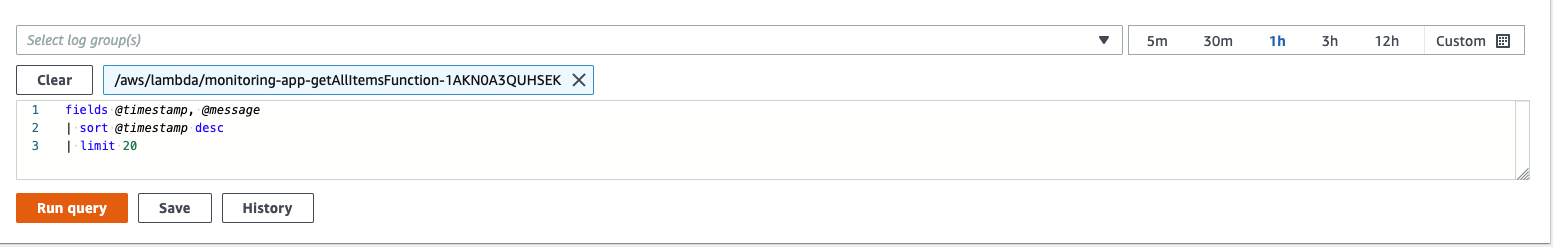
As you can see a sample query is automatically placed in the query field.
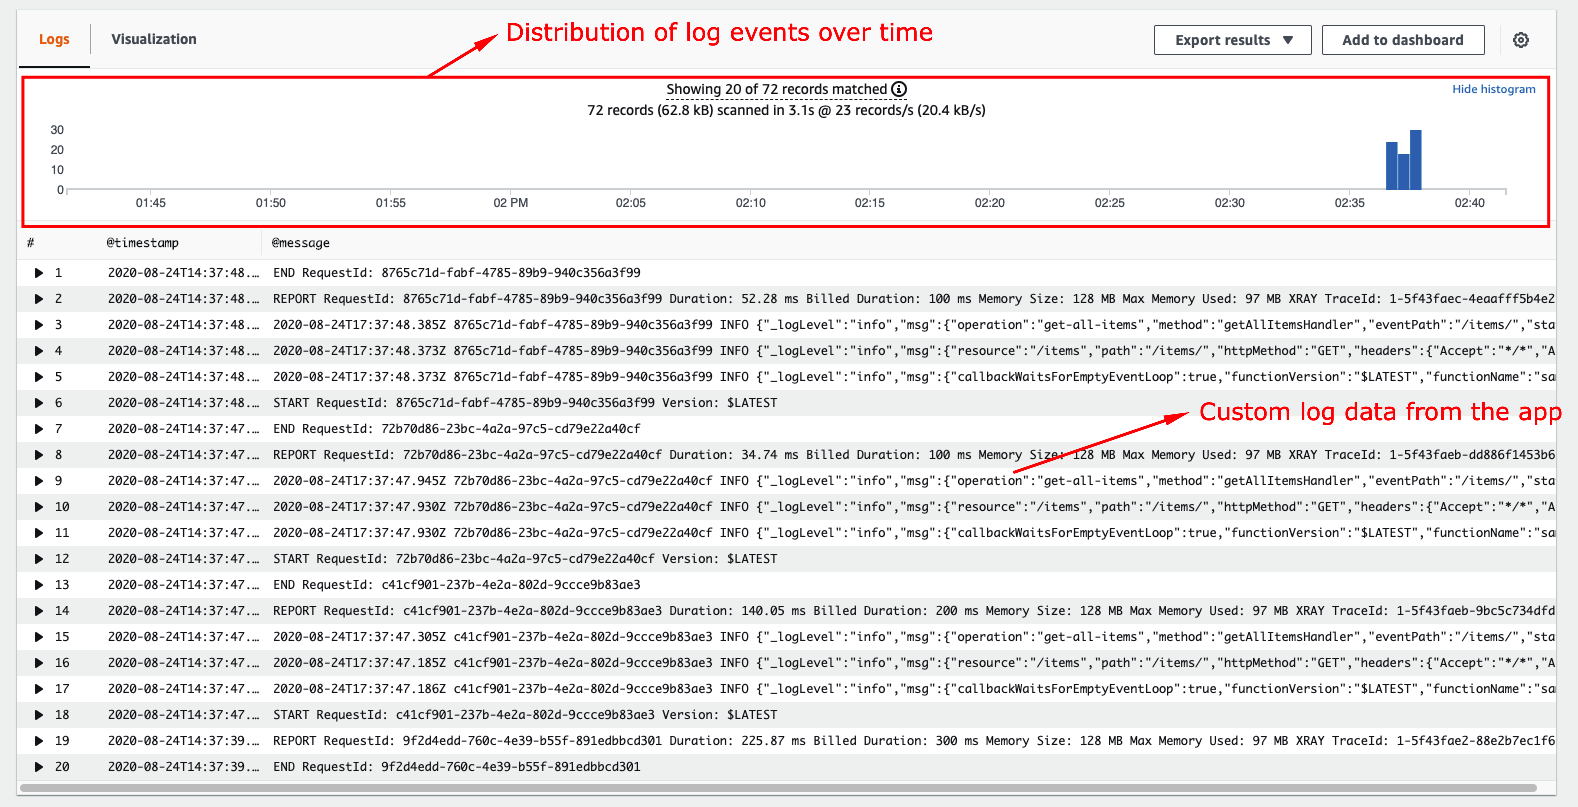
Now simply click on Run query button to execute the query results. As expected, you will see results from the query.
The sample query fetches the @timestamp and @message fields from the log data, orders by the timestamp field in descending order and displays the first 20 records.
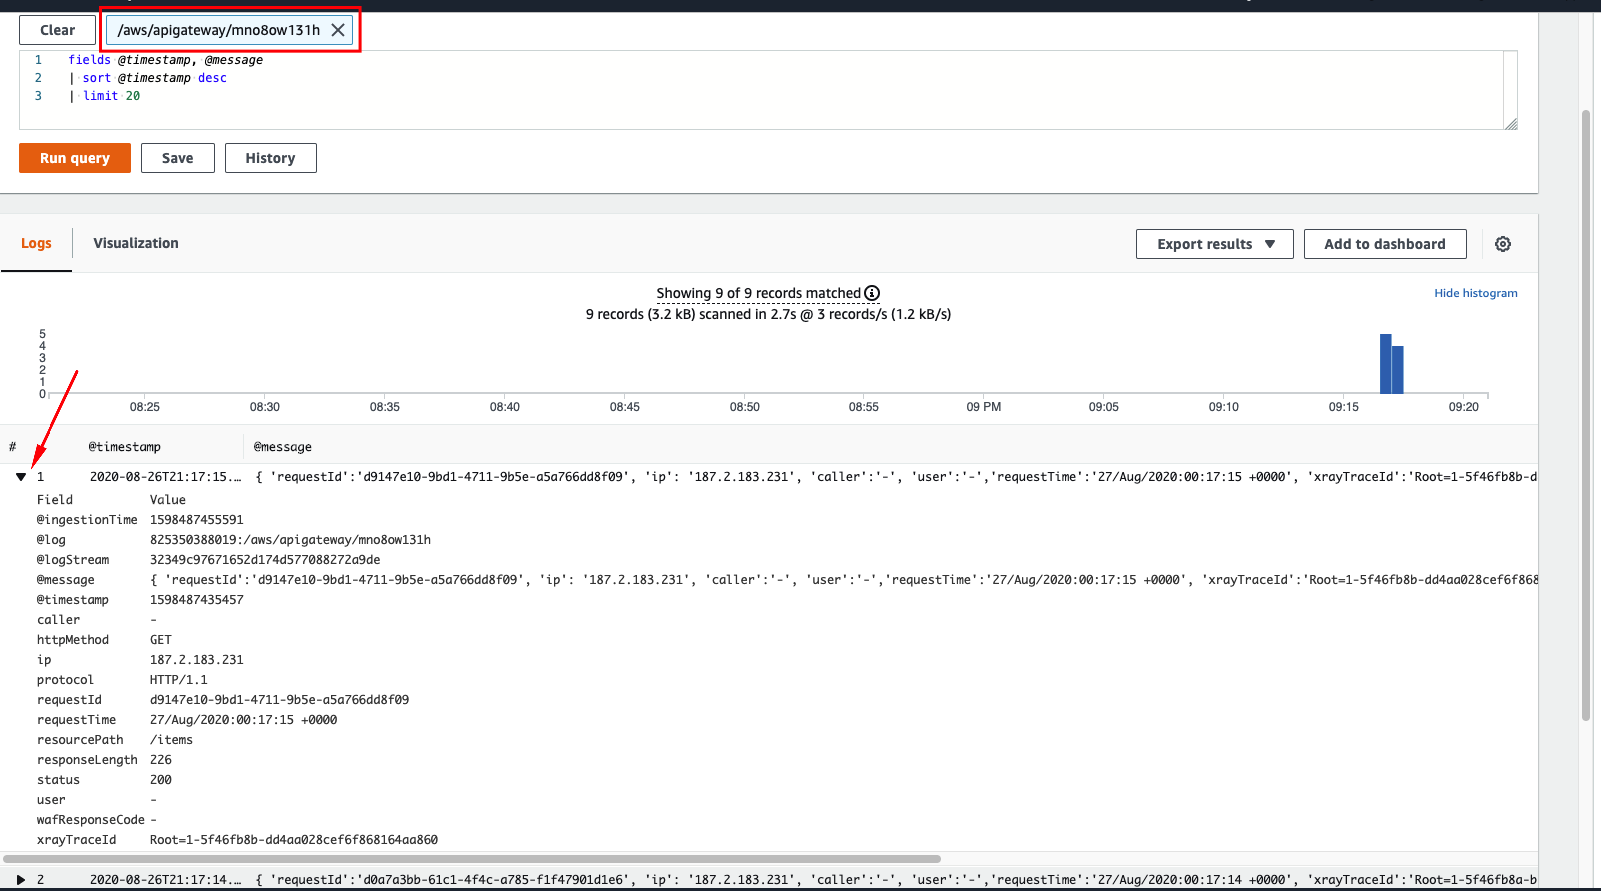
Querying API Gateway Custom Access Logging
You can also switch your log group preference to the /aws/apigateway/ log group in order to query for access logs of our API, while maintaining the same query statement.
Learn more about Logs Insights syntax and queries here
Simple list with filter and sort
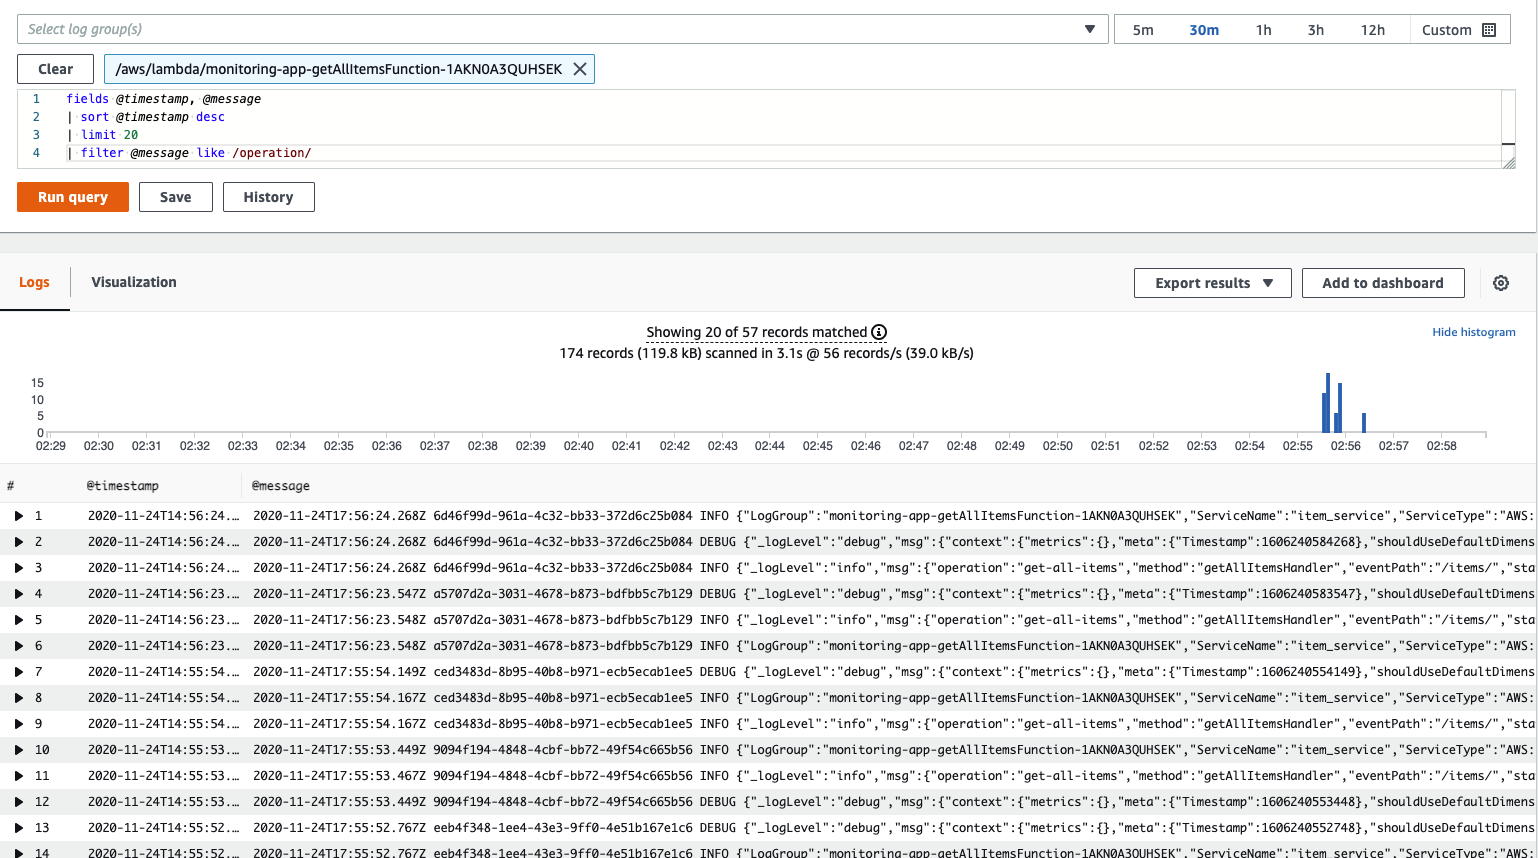
Select once again the /aws/lambda/monitoring-app-getAllItemsFunction log group.
Now paste this query into the log field. The following query applies a filter on the messages and fetches only the records that contain the string operation in the log event and displays the result ordered by the timestamp field in descending order
fields @timestamp, @message
| sort @timestamp desc
| limit 20
| filter @message like /operation/
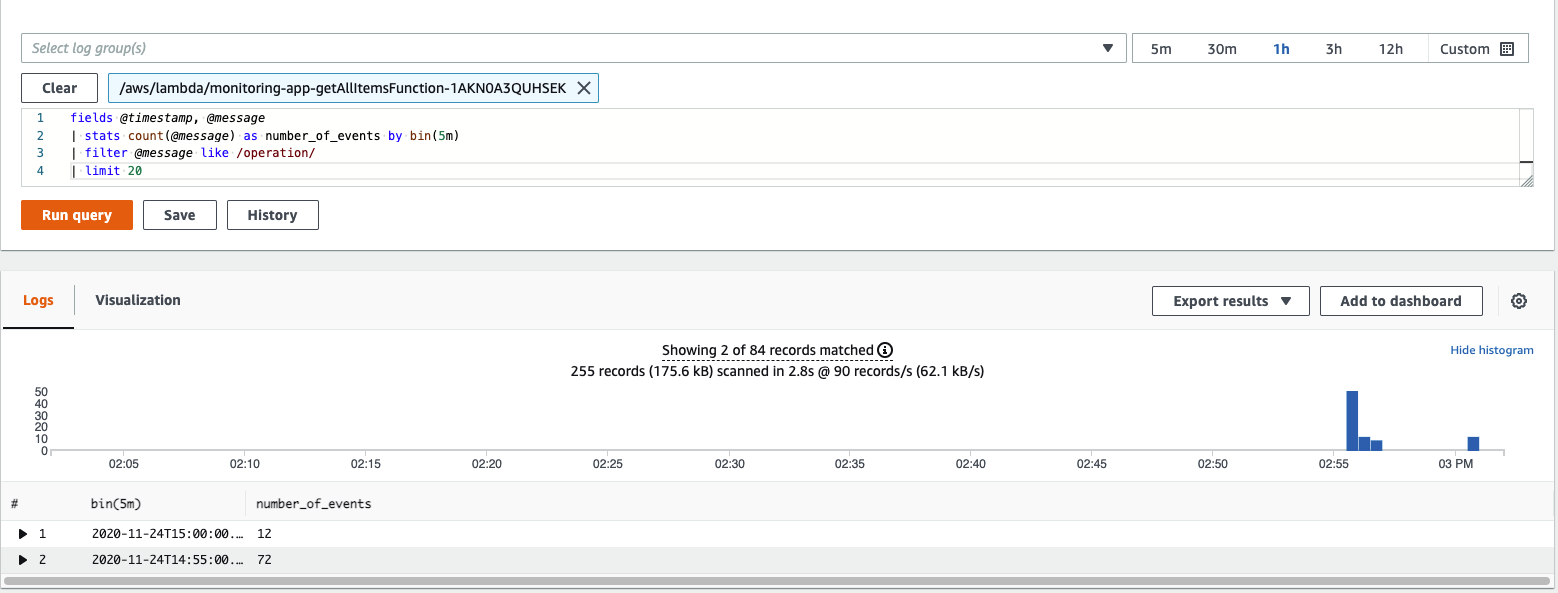
List with aggregation, sort and timeseries
Now paste this query into the log field. The following shows a result that contains the number of messages captured by 5 minute interval
fields @timestamp, @message
| stats count(@message) as number_of_events by bin(5m)
| filter @message like /operation/
| limit 20
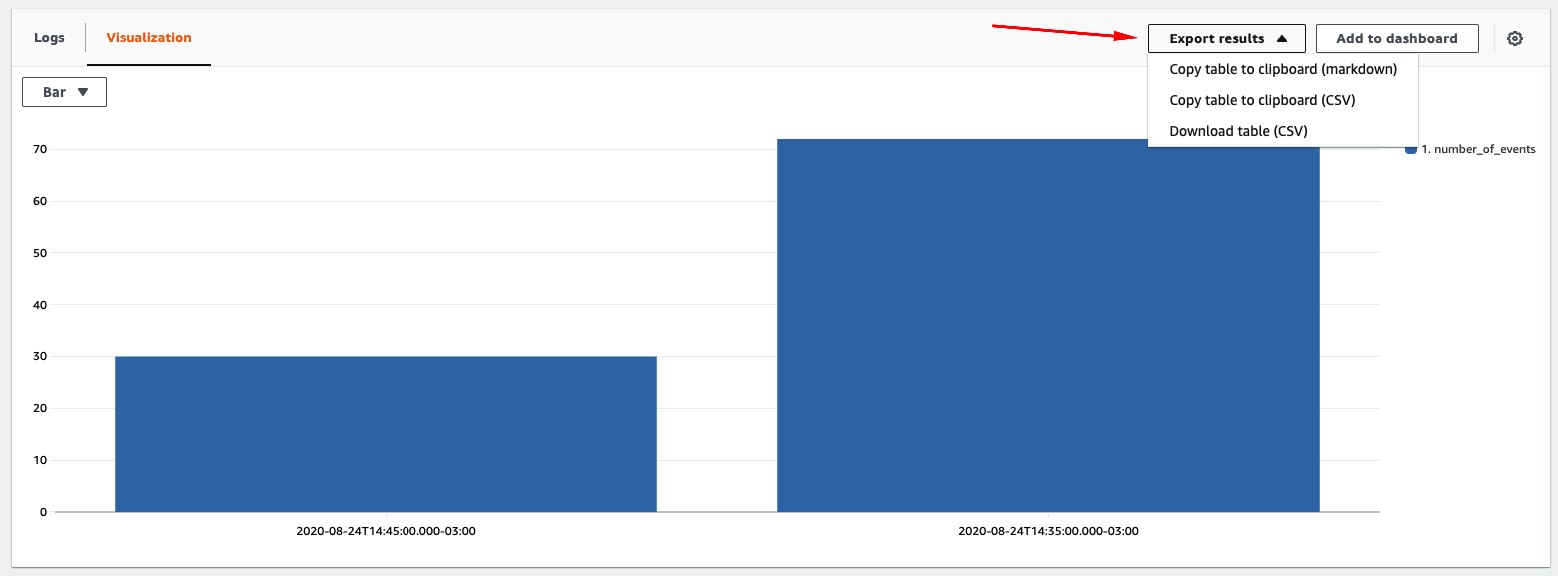
You can also visualize the results by clicking on the Visualization tab in the results area as shown below.
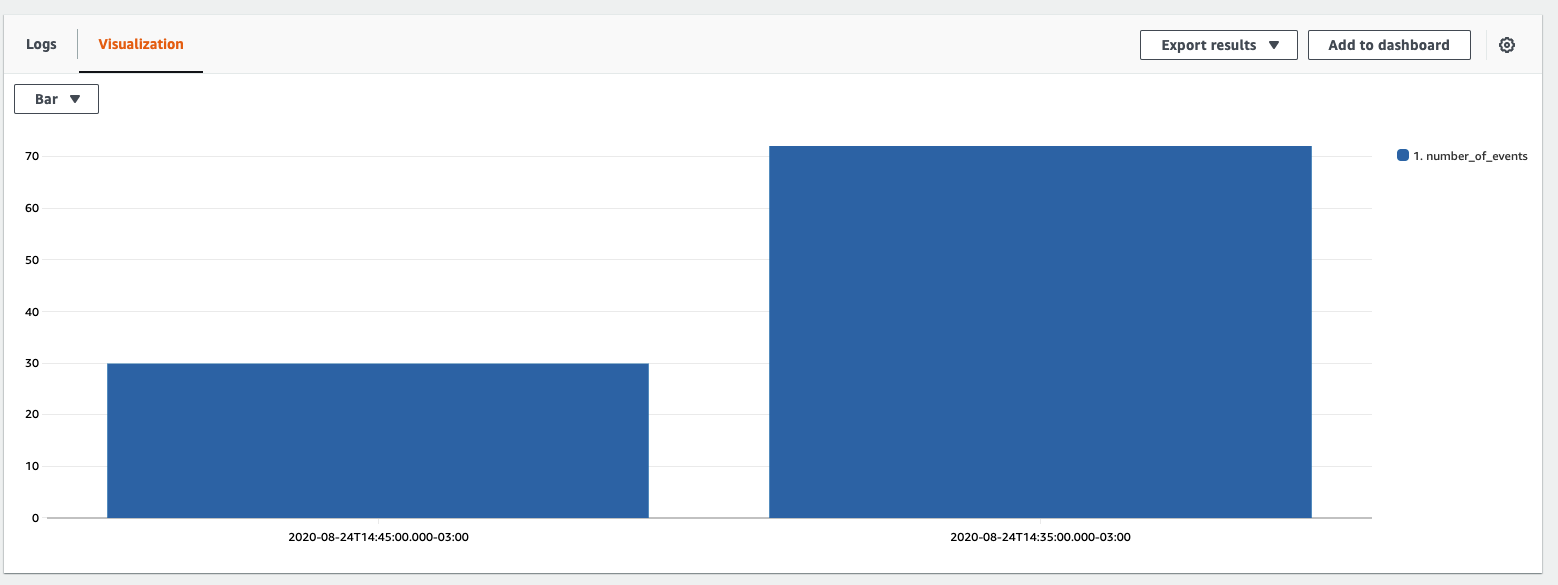
Notice that you can also add the visualization to a CloudWatch Dashboard, export to csv and so on.
Querying using AWS CLI
You can query the log groups using AWS CLI as well. The query below queries top 10 log records from a log group for a specific time period.
Make sure you replace the log group to the appropriate one you have on your account and change the start and end time parameter values to the right epoch time values. You can calculate epoch time values from this public website - https://www.epochconverter.com/
For simplicity reasons, the timestamps below are set between 24th Aug, 2020 to 24th Aug, 2022.
export getAllItemsFunction=$(aws cloudformation describe-stack-resources --stack-name monitoring-app --output json | jq '.StackResources[] | select(.LogicalResourceId=="getAllItemsFunction") | .PhysicalResourceId' | sed -e 's/^"//'  -e 's/"$//')
aws logs start-query --log-group-name /aws/lambda/$getAllItemsFunction --start-time '1598288209' --end-time '1661364126' --query-string 'fields @message | limit 10'
The above query will return a queryId. Copy that query Id and replace the <QUERY_ID> string. in the below command and execute it to see log data results.
aws logs get-query-results --query-id <QUERY_ID>