Adding Active Tracing
X-Ray Active Tracing is a feature that automatically captures inbound calls to AWS Services (Lambda, API Gateway, SNS, SQS, and others) without requiring you to instrument any code. SAM and other frameworks also provide built-in support for you to enable active tracing in your resources during development-time.
Learn more about X-Ray Active Tracing from our documentation.
Modify the application
Go back to your Cloud9 environment and open your app workspace at serverless-observability-workshop/code/sample-app-tracing.
We are going to edit the serverless-observability-workshop/code/sample-app-tracing/template.yaml file to include Active Tracing for all Lambda functions and API Gateway stages we add in our template. Open the your YAML template and locate the Global section. Enable both Tracing attribute for Lambda and TracingEnabled for API Gateway.
Globals:
  Function:
    Runtime: nodejs12.x
    Timeout: 100
    Tracing: Active # <----- ADD FOR LAMBDA
    MemorySize: 128
    CodeUri: ./
    Environment:
      Variables:
        APP_NAME: !Ref SampleTable
        SAMPLE_TABLE: !Ref SampleTable
        SERVICE_NAME: item_service
        ENABLE_DEBUG: false
        # Enable usage of KeepAlive to reduce overhead of short-lived actions, like DynamoDB queries
        AWS_NODEJS_CONNECTION_REUSE_ENABLED: 1
  Api:                    # <----- ADD FOR API
    TracingEnabled: true  # <----- ADD FOR API
Save your changes to the serverless-observability-workshop/code/sample-app-tracing/template.yaml file.
Deploy your application
cd ~/environment/serverless-observability-workshop/code/sample-app-tracing
sam build
sam deploy
Test the APIs
Export the stack output variables
To invoke our API’s, we first need to fetch the ApiUrl output variable that our CloudFormation stack gives us. So let us iterate through our stack and export all output variables as environment variables:
export ApiUrl=$(aws cloudformation describe-stacks --stack-name monitoring-app-tracing --output json | jq '.Stacks[].Outputs[] | select(.OutputKey=="ApiUrl") | .OutputValue' | sed -e 's/^"//'  -e 's/"$//')
echo "export ApiUrl="$ApiUrl
Test the Get All Items operation
curl -X GET $ApiUrl/items/ | jq
Validate the result
Go to ServiceLens Service Map page.
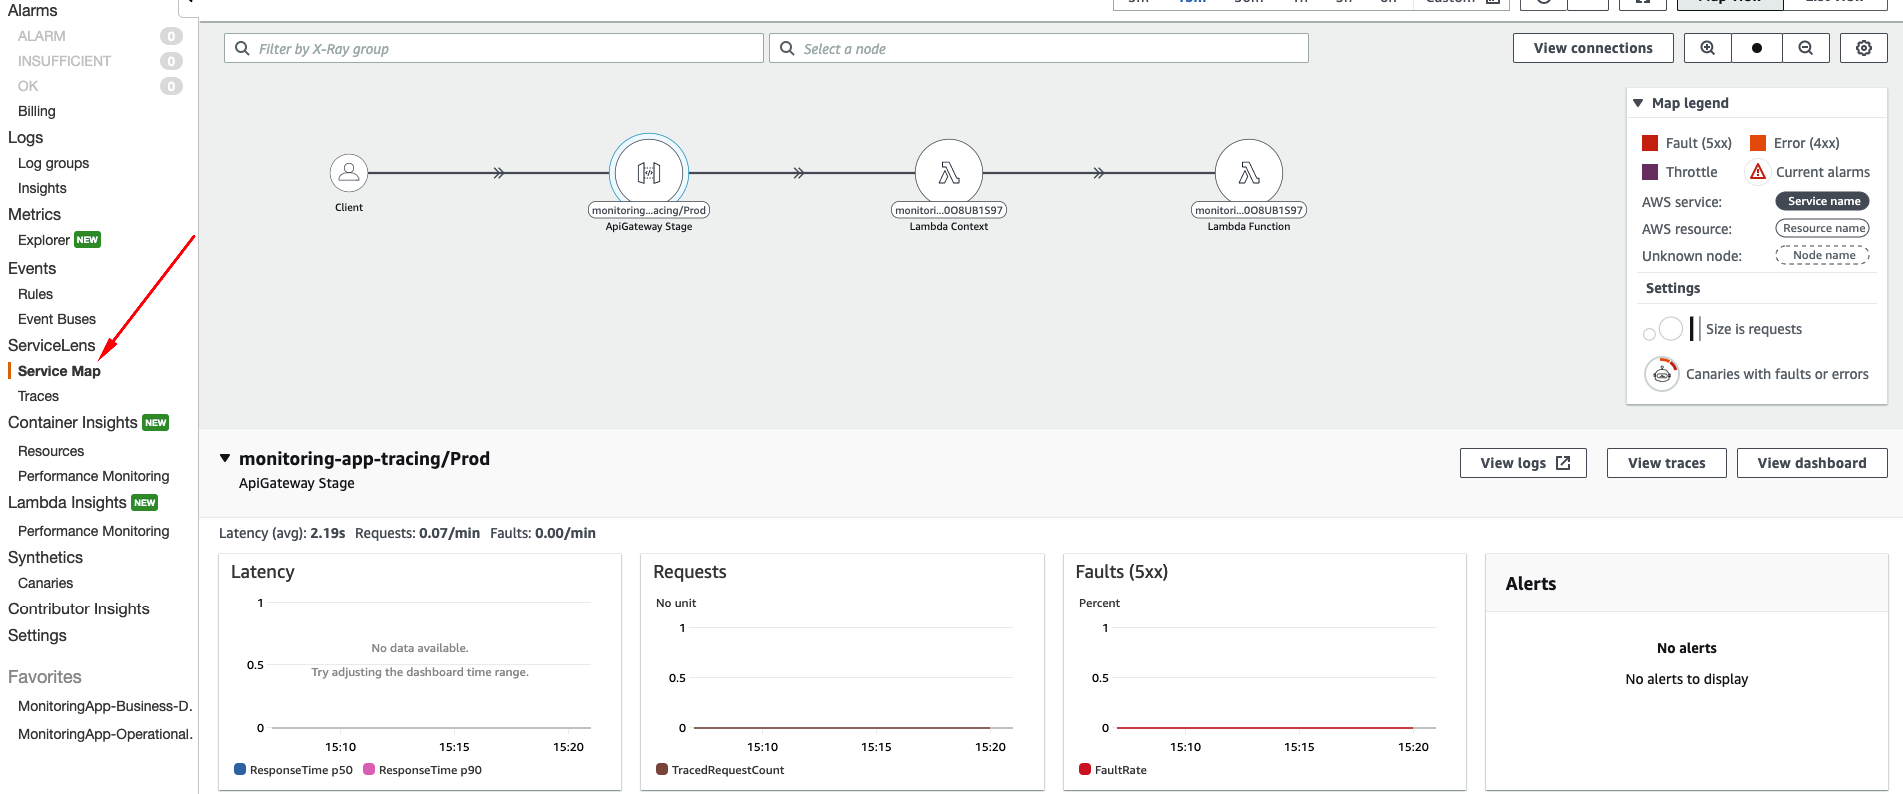
You are now able to see the tracing between Client -> API Gateway -> Lambda with some additional properties such as each node’s latency, requests/secs, and 5xx erros without instrumenting any type of code. But that doesn’t really add much value in case we need to perform any deeper troubleshootings, right? In the next step, we are going to start instrumenting calls to other AWS services in our application.