Intercepting AWS SDK Calls
In this step, we are going to add a small change to our application using the AWS X-Ray SDK in order to trace all AWS SDK calls inside our Lambda functions. This will give us further visibility on what’s going on during a function execution, as well as a better glimpse to any bottlenecks we couldn’t see before. For example, a Lambda function might take 10s to complete, but 9s can be spent calling a DynamoDB table. Having this information in hand help us focus our efforts to enhance our DynamoDB query code or even remodel our DynamoDB tables and/or rethink our data access patterns.
You can learn more on how to leverage the AWS X-Ray SDK to capture traces all AWS SDK calls, Incoming Requests, Outgoing HTTP Calls, and SQL Queries
Modify the application
Go back you your Cloud9 environment and open your app workspace at serverless-observability-workshop/code/sample-app-tracing/src/handlers/put-item.js.
We are now going import the aws-xray-sdk-core module and instead of purely requiring the aws-sdk module using the const AWS = AWSXRay.captureAWS(require('aws-sdk')) syntax, we are going to import it using X-Ray to capture all AWS Services calls using the AWS SDK.
const AWSXRay = require('aws-xray-sdk-core')
const AWS = AWSXRay.captureAWS(require('aws-sdk'))
You should also modify in the same way the Lambda functions located at:
serverless-observability-workshop/code/sample-app-tracing/src/handlers/get-all-items.jsserverless-observability-workshop/code/sample-app-tracing/src/handlers/get-by-id.jsserverless-observability-workshop/code/sample-app-tracing/src/handlers/notify-item.js
Deploy your application
cd ~/environment/serverless-observability-workshop/code/sample-app-tracing
sam build
sam deploy
Test the APIs
Export the stack output variables
To invoke our API’s, we first need to fetch the ApiUrl output variable that our CloudFormation stack gives us. So let us iterate through our stack and export all output variables as environment variables:
export ApiUrl=$(aws cloudformation describe-stacks --stack-name monitoring-app-tracing --output json | jq '.Stacks[].Outputs[] | select(.OutputKey=="ApiUrl") | .OutputValue' | sed -e 's/^"//'  -e 's/"$//')
echo "export ApiUrl="$ApiUrl
Test the Put Item operation
curl -X POST \
  $ApiUrl/items/ \
  -d '{
        "id":"3",
        "name": "Third test item"
  }'

curl -X POST \
  $ApiUrl/items/ \
  -d '{
        "id":"4",
        "name": "Fourth test item"
  }'
Test the Get All Items operation
curl -X GET $ApiUrl/items/ | jq
Test the Get Item by Id operation
curl -X GET $ApiUrl/items/3 | jq
curl -X GET $ApiUrl/items/4 | jq
Validate the result
Go to ServiceLens Service Map page.
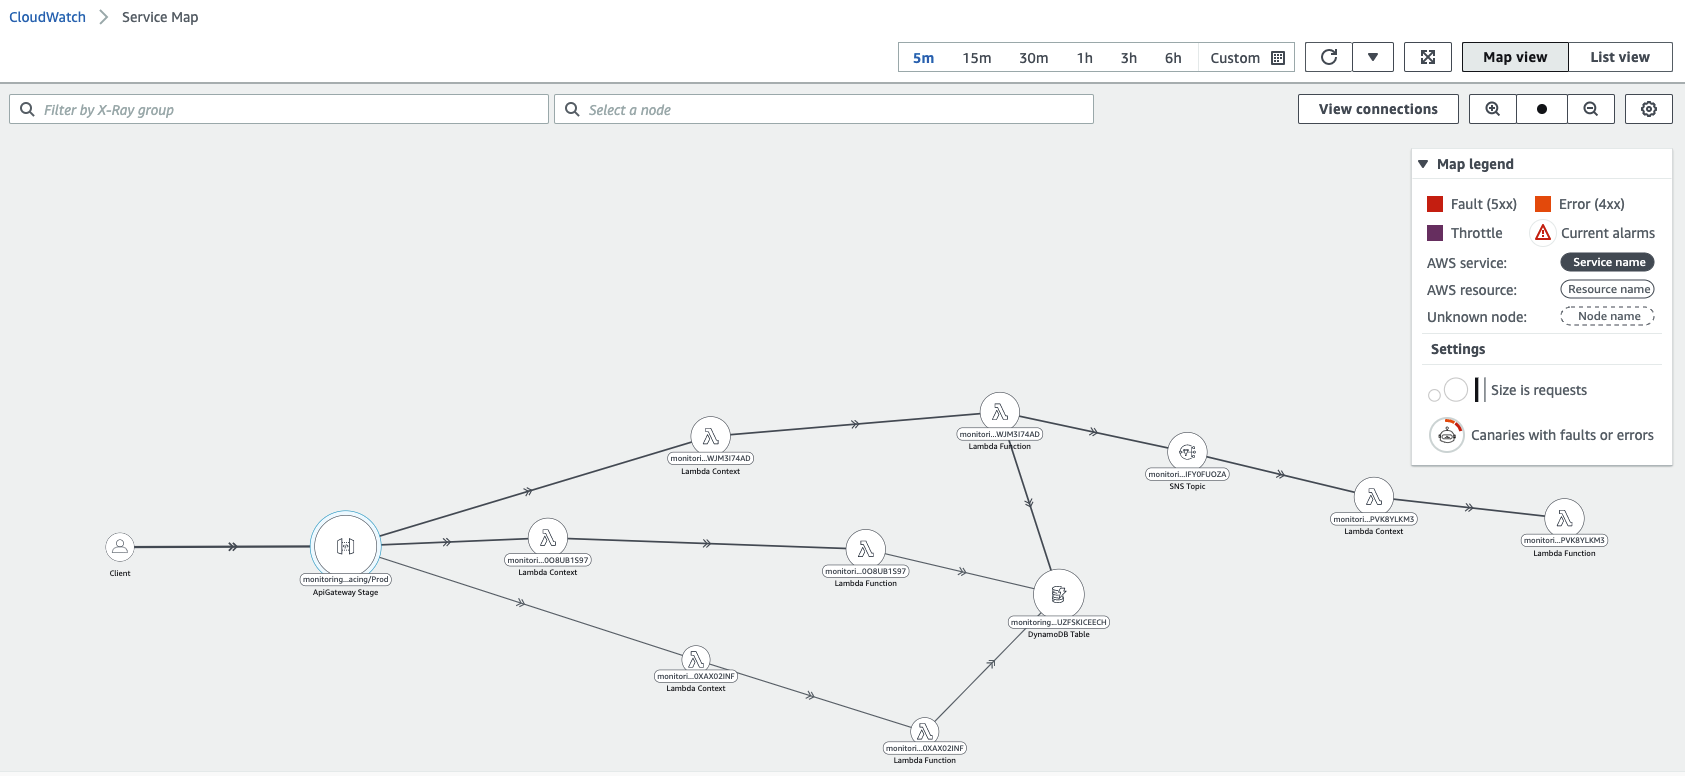
You are now able to see the tracing between Client -> API Gateway -> Lambda -> Other Downstream Services and the same additional properties (latency, requests/secs, and 5xx erros) we already saw in the previous step.
- Click the notifyNewItemFunction node in the Service Map.
- Click View Traces
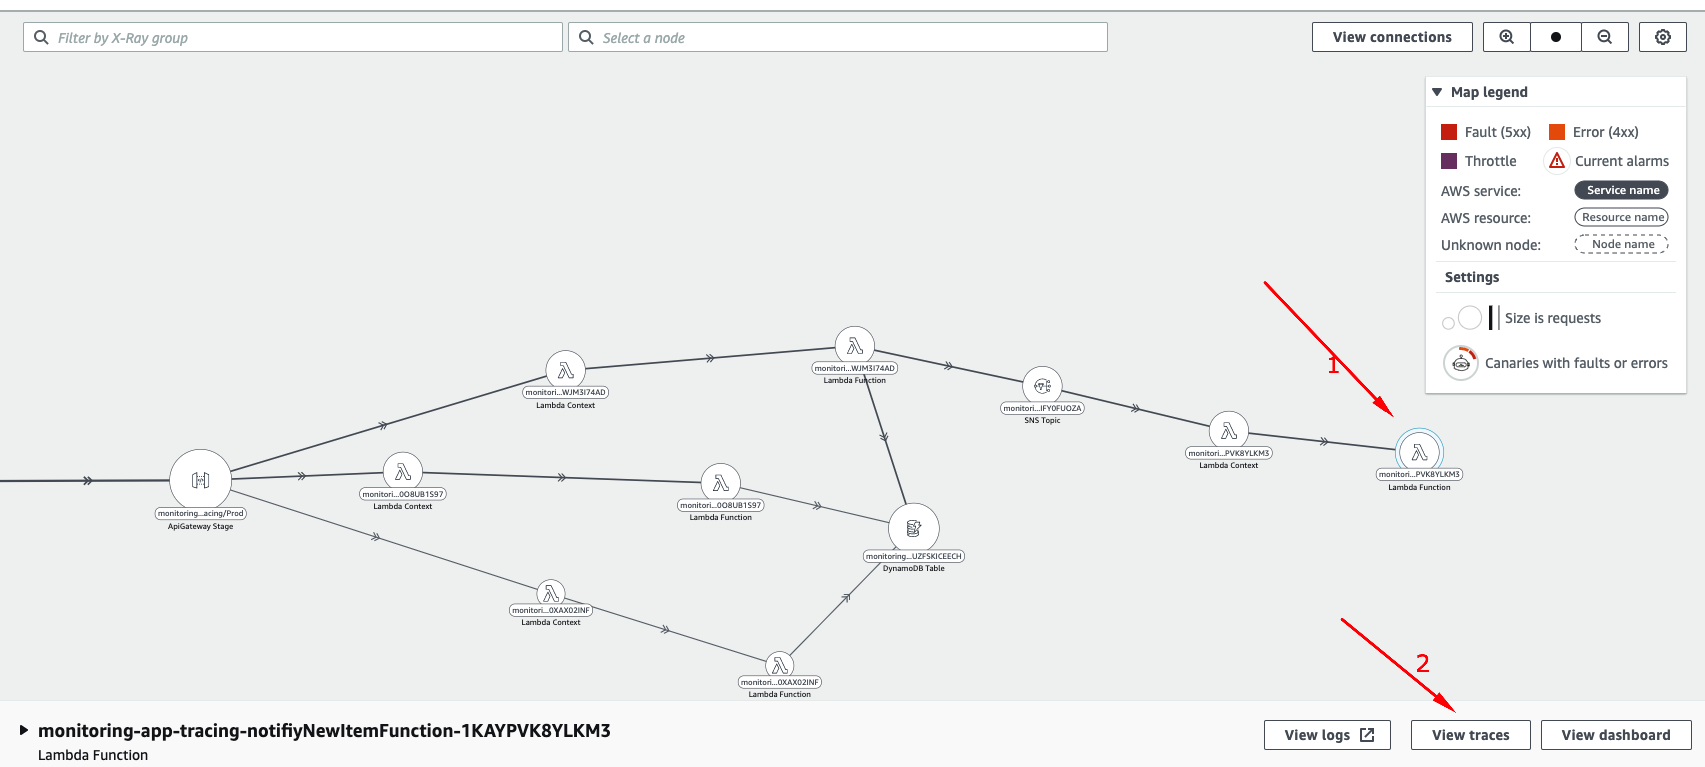
You can now see the entire tracing for all requests of a given node, as well as filter them by wide range of attributes and custom annotations (which we will be adding in the next step).
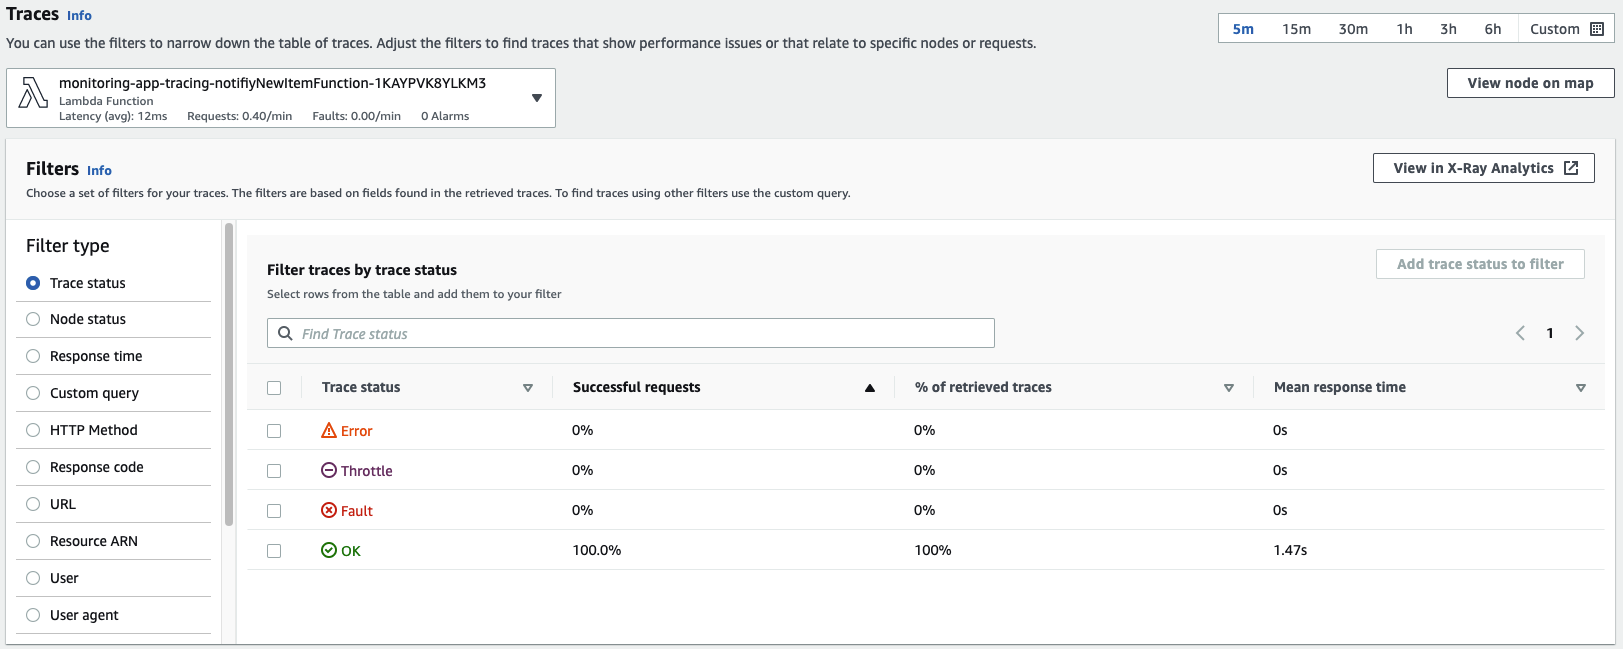
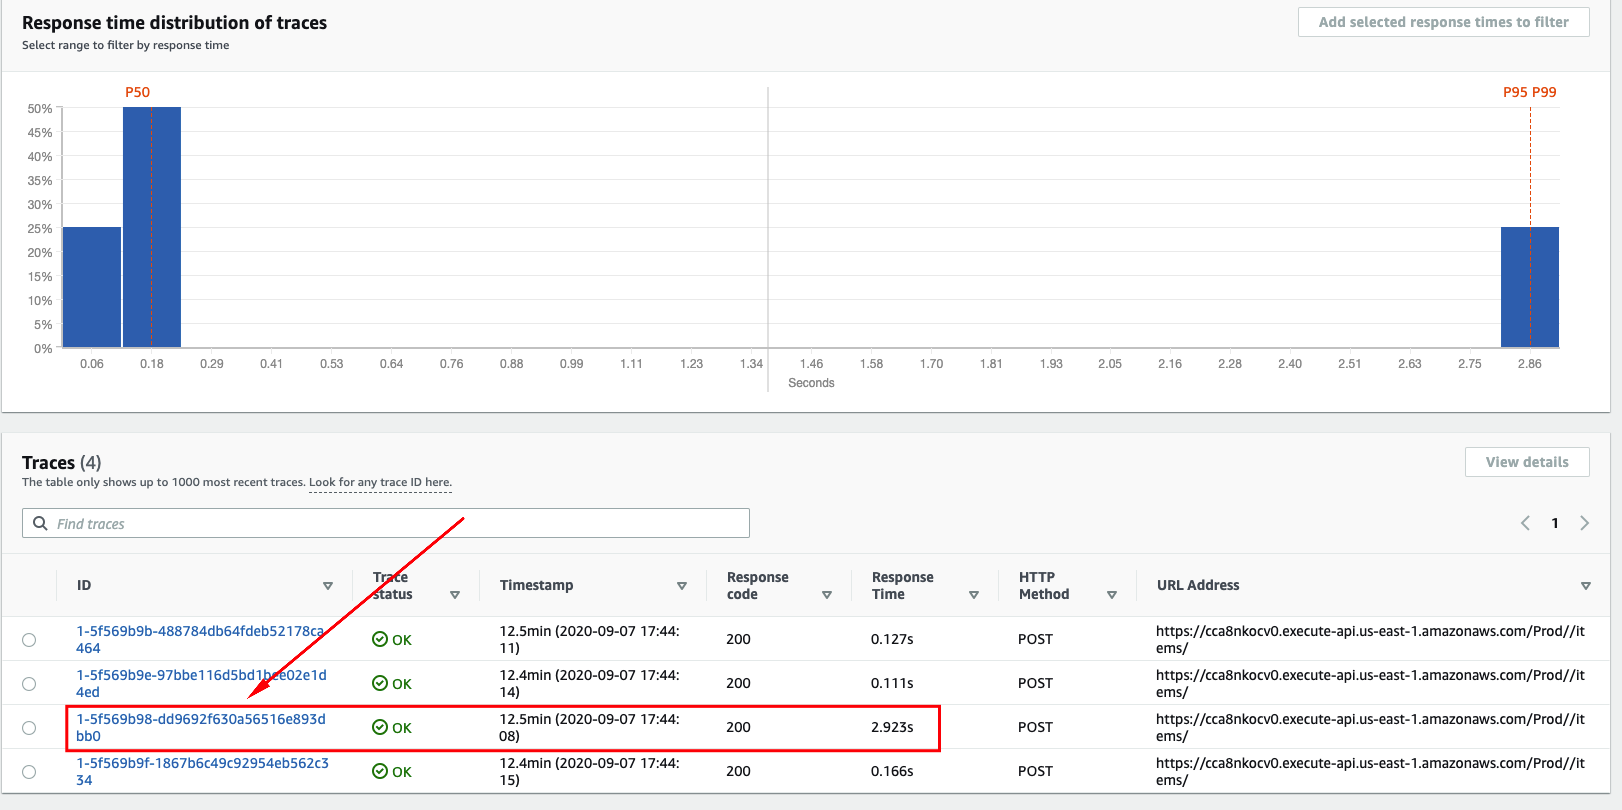
You can also visualize the response time distribution of your traces and check for them individually.
- Click the trace with the
most discrepant response time, which most likely represents a Lambda function containing aCold Start.
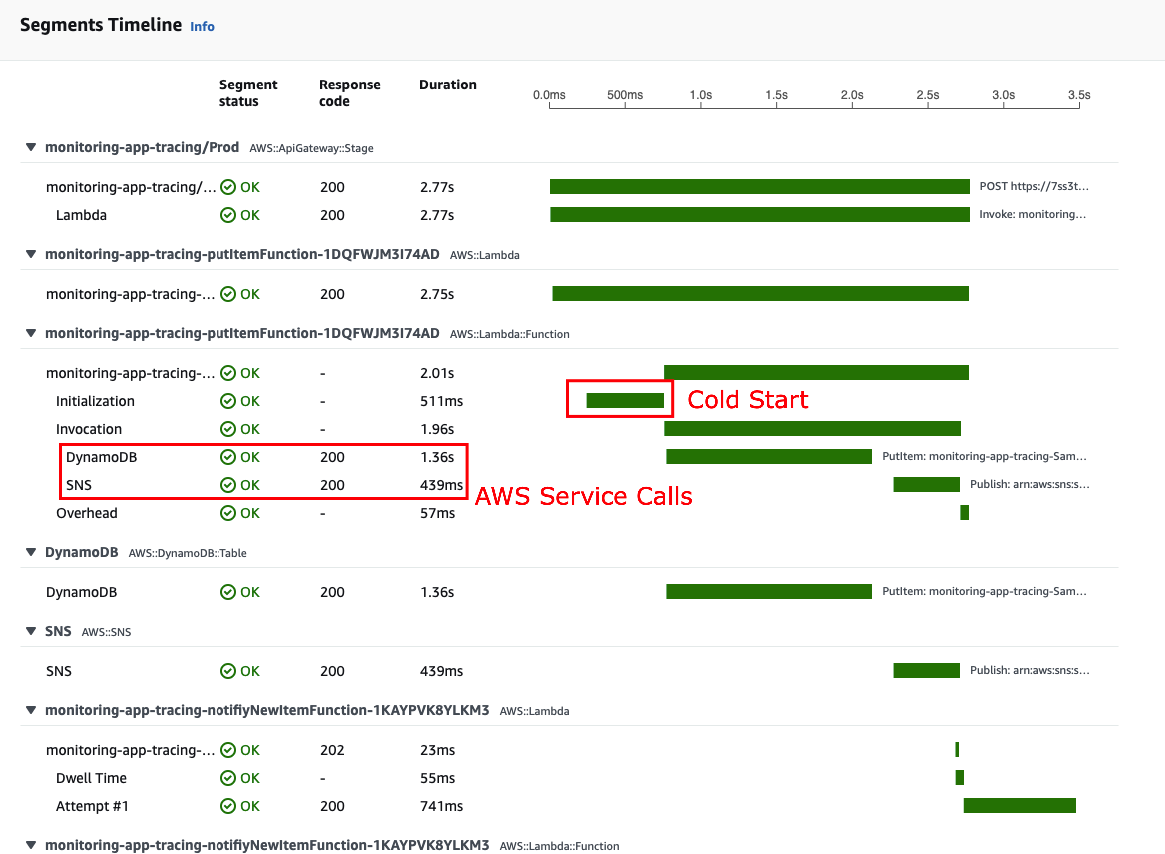
You are now able to dig into the details of a specific request you want to troubleshoot or understand its behavior. You can see full mesh of calls performed by the main function and its downstream dependencies, as well as its full response time, status code and so on.
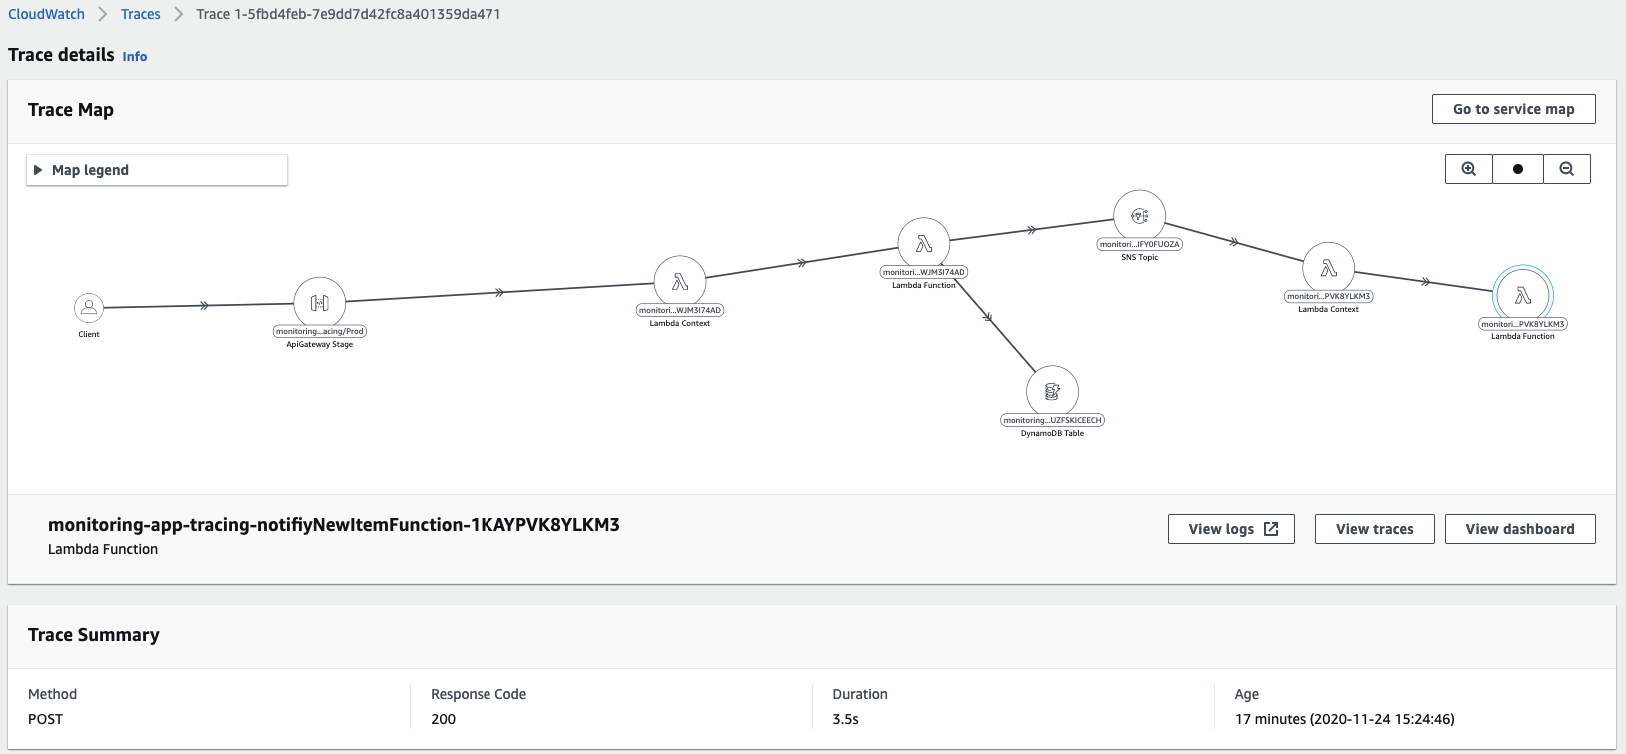
You can also see the response time and additional annotations and metadada of each segment and subsegment for each node of the request trace. Analyzing a bit further, you can see the AWS X-Ray SDK captured the calls we did to both DynamoDB and SNS, as well as the API Operations we performed.