AWS Serverless Observability Workshop > Distributed Tracing > Subsegments & Annotations > Deploy & Validate Your Tracing
Deploy & Validate Your Tracing
Deploy your application
cd ~/environment/serverless-observability-workshop/code/sample-app-tracing
sam build
sam deploy
Test the APIs
Export the stack output variables
To invoke our API’s, we first need to fetch the ApiUrl output variable that our CloudFormation stack gives us. So let us iterate through our stack and export all output variables as environment variables:
export ApiUrl=$(aws cloudformation describe-stacks --stack-name monitoring-app-tracing --output json | jq '.Stacks[].Outputs[] | select(.OutputKey=="ApiUrl") | .OutputValue' | sed -e 's/^"//'  -e 's/"$//')
echo "export ApiUrl="$ApiUrl
Test the Put Item operation
curl -X POST \
  $ApiUrl/items/ \
  -d '{
        "id":"5",
        "name": "Fifth test item"
  }'

curl -X POST \
  $ApiUrl/items/ \
  -d '{
        "id":"6",
        "name": "Sixth test item"
  }'
Test the Get All Items operation
curl -X GET $ApiUrl/items/ | jq
Test the Get Item by Id operation
curl -X GET $ApiUrl/items/5 | jq
curl -X GET $ApiUrl/items/6 | jq
Validate the result
Go to ServiceLens Traces page.
Scroll down the Filter type list. You are now able to visualize the three different annotations we created as additional filters for your traces.
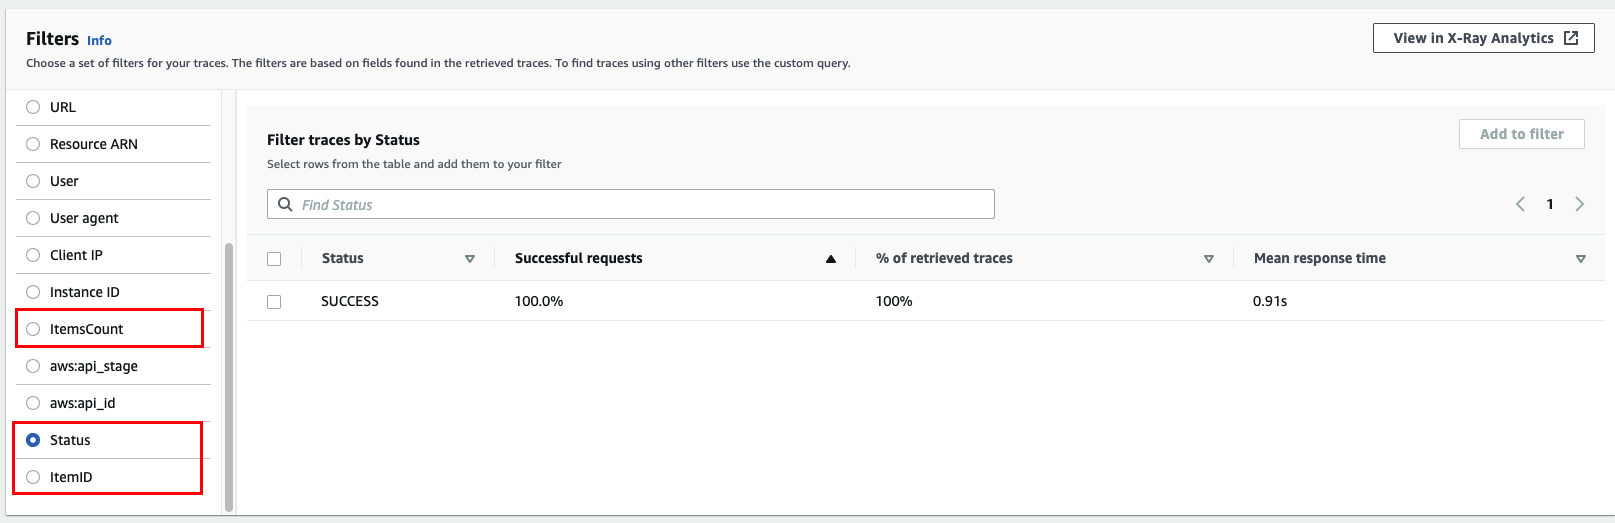
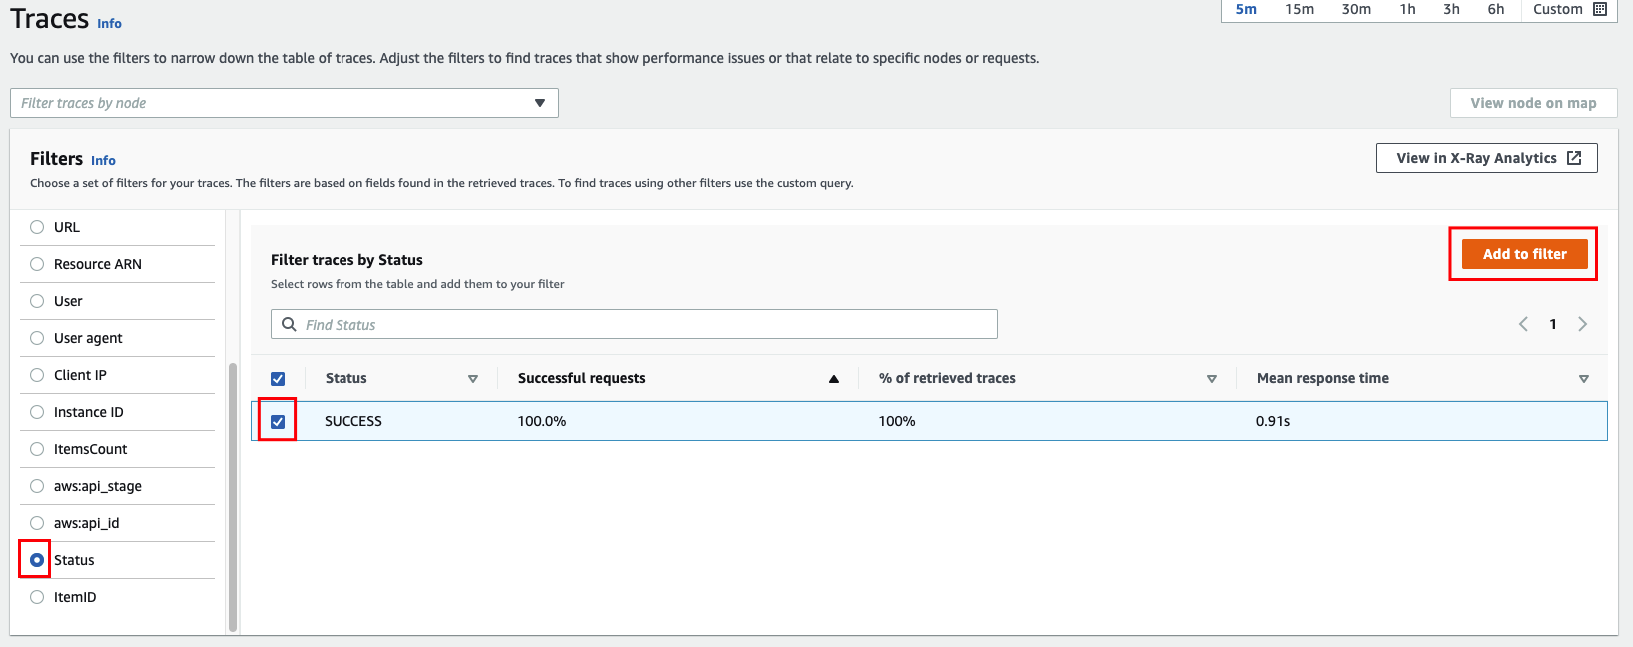
- Select Status.
- Select SUCCESS.
- Click Add to filter.
- Click one of the traces for POST HTTP Method.
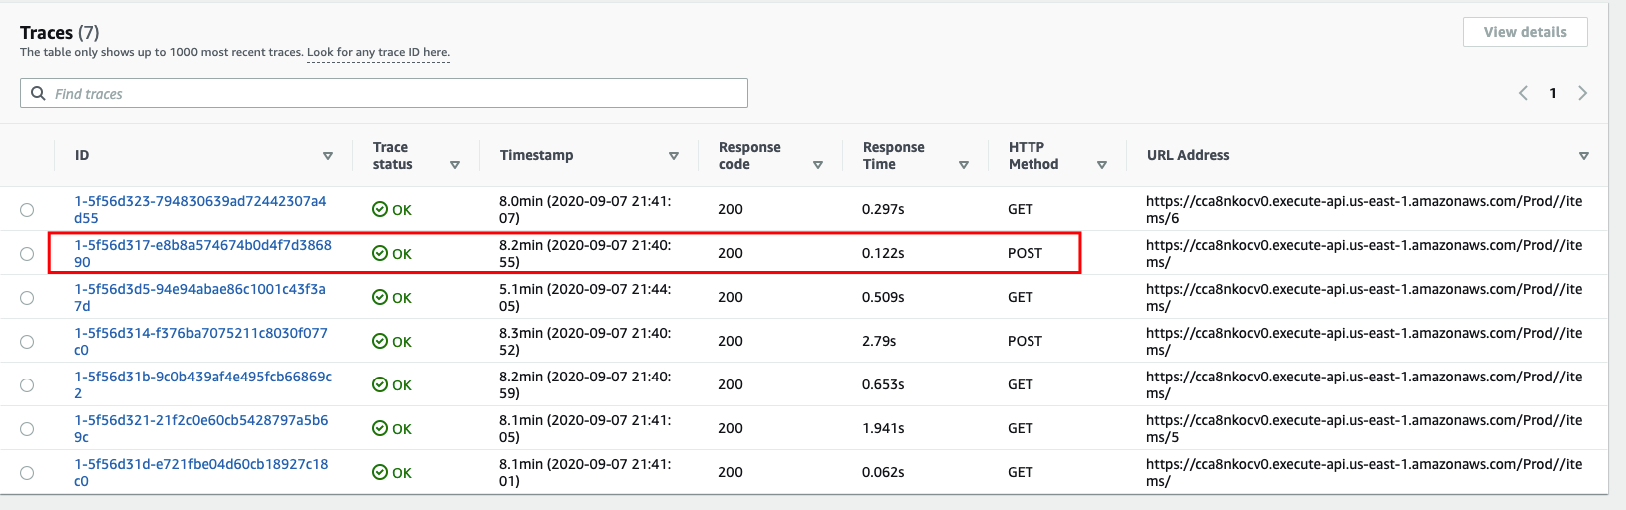
This time, you will be able to see the additional subsegments we created are now appearing with its respective response times.
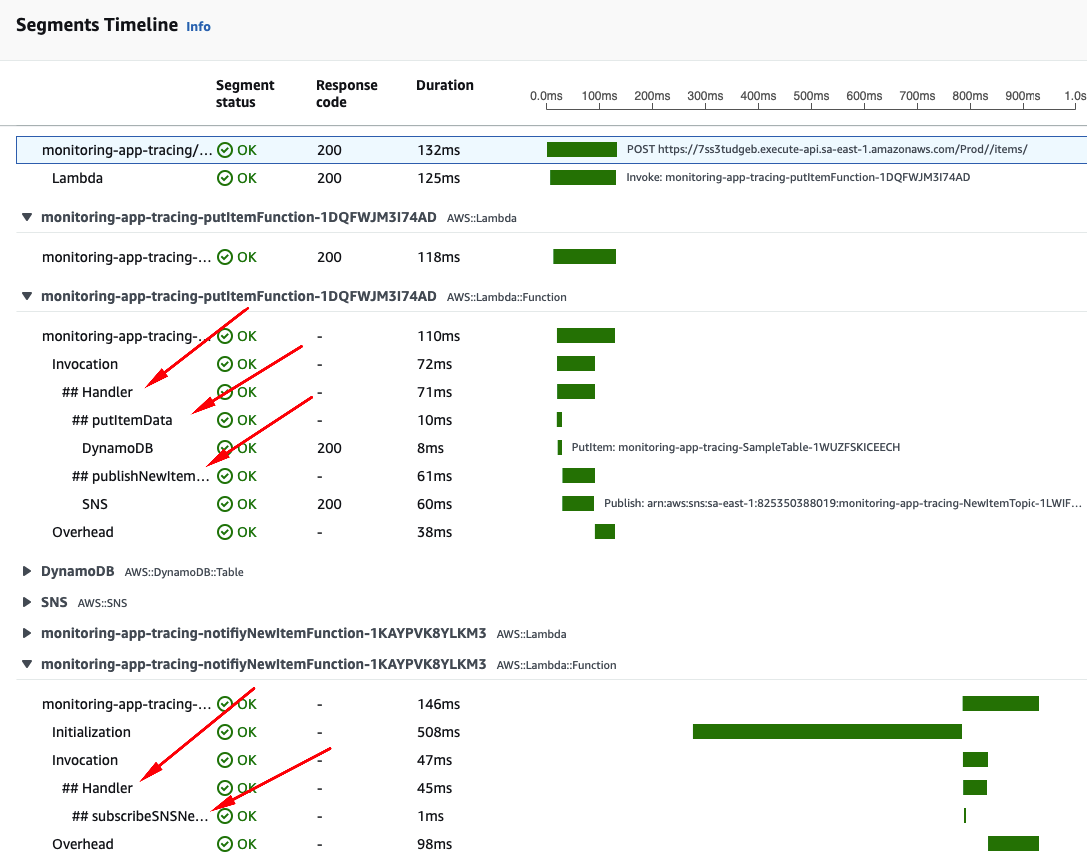
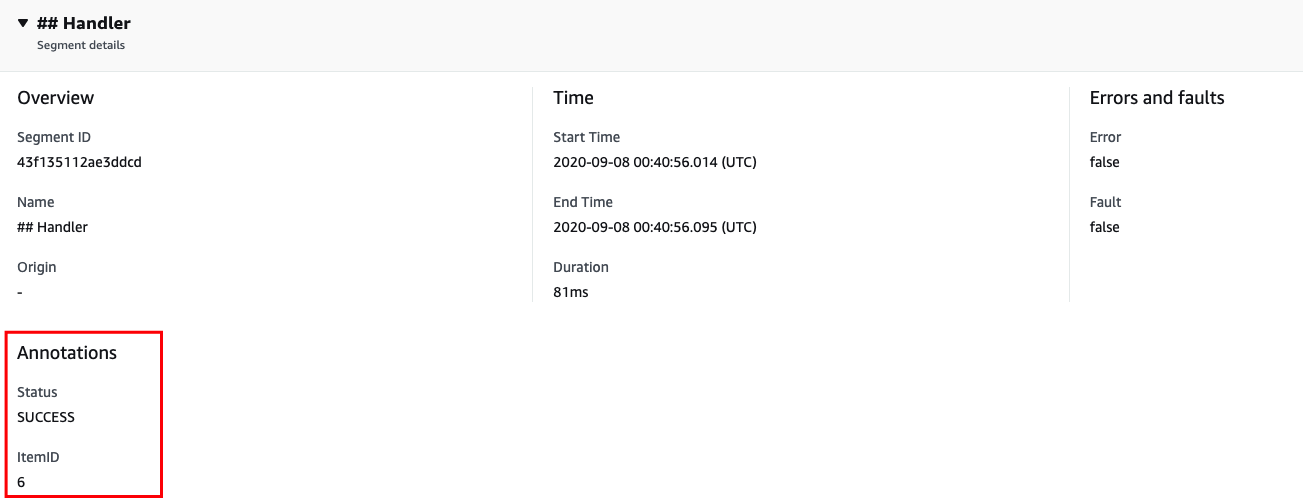
- Click the ## Handler subsegment and scroll down to
Segment detailsarea. You should be able to see the custom annotations you added inside that subsegment.
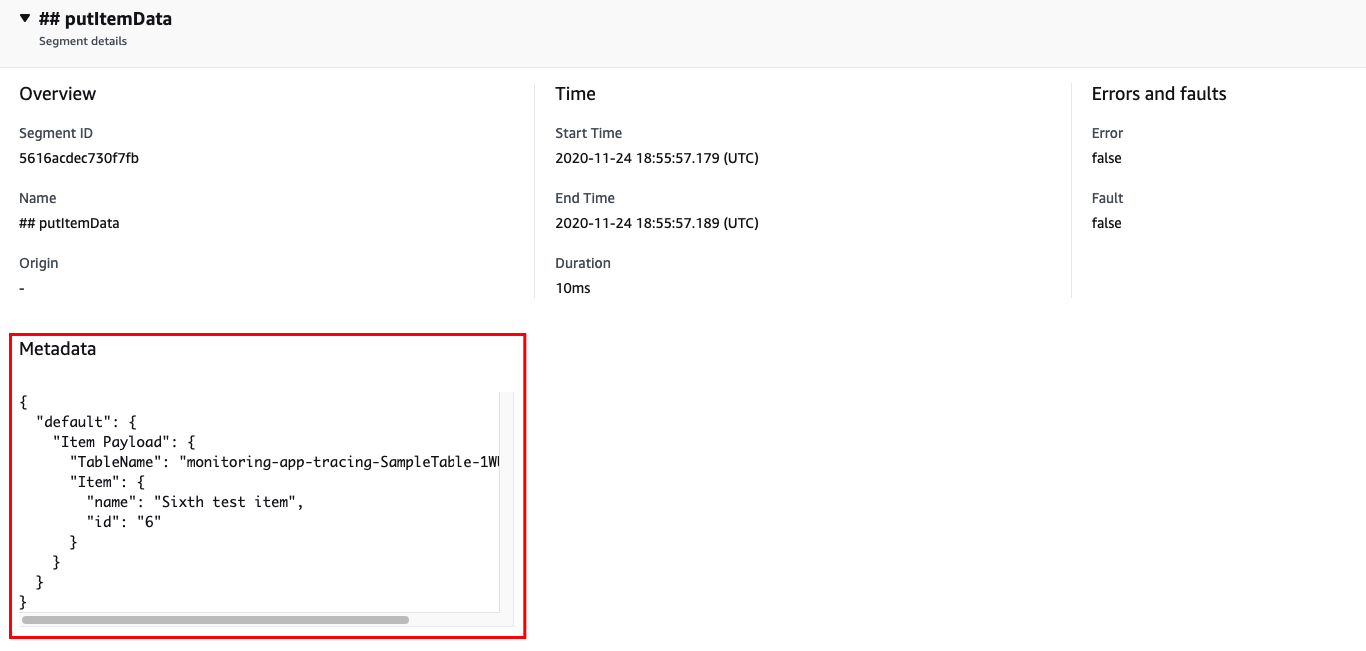
- Click the ## putItemData subsegment and scroll down to
Segment detailsarea. You should be able to see the custom metadata you added inside that subsegment.
Spare a couple minutes to analyze the Service Map and Traces for the Get Item By Id and Get All Items as well.