Create X-Ray Groups
Using a filter expression, you can define criteria by which to accept traces into the group.
You can call the group by name or by Amazon Resource Name (ARN) to generate its own service graph, trace summaries, and Amazon CloudWatch metrics. Once a group is created, incoming traces are checked against the group’s filter expression as they are stored in the X-Ray service. Metrics for the number of traces matching each criteria are published to CloudWatch every minute.
Updating a group’s filter expression doesn’t change data that’s already recorded. The update applies only to subsequent traces. This can result in a merged graph of the new and old expressions. To avoid this, delete the current group and create a fresh one.
Create X-Ray Group
-
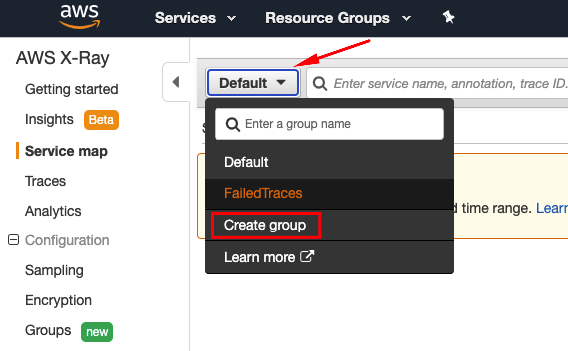
Go to AWS XRay and click on the Default drop down and select Create group.
-
In the new window, name the group Higherlatency and enter the following expression. This is a simple expression that filters only requests that exhibit more than 2 seconds response time.
responsetime > 2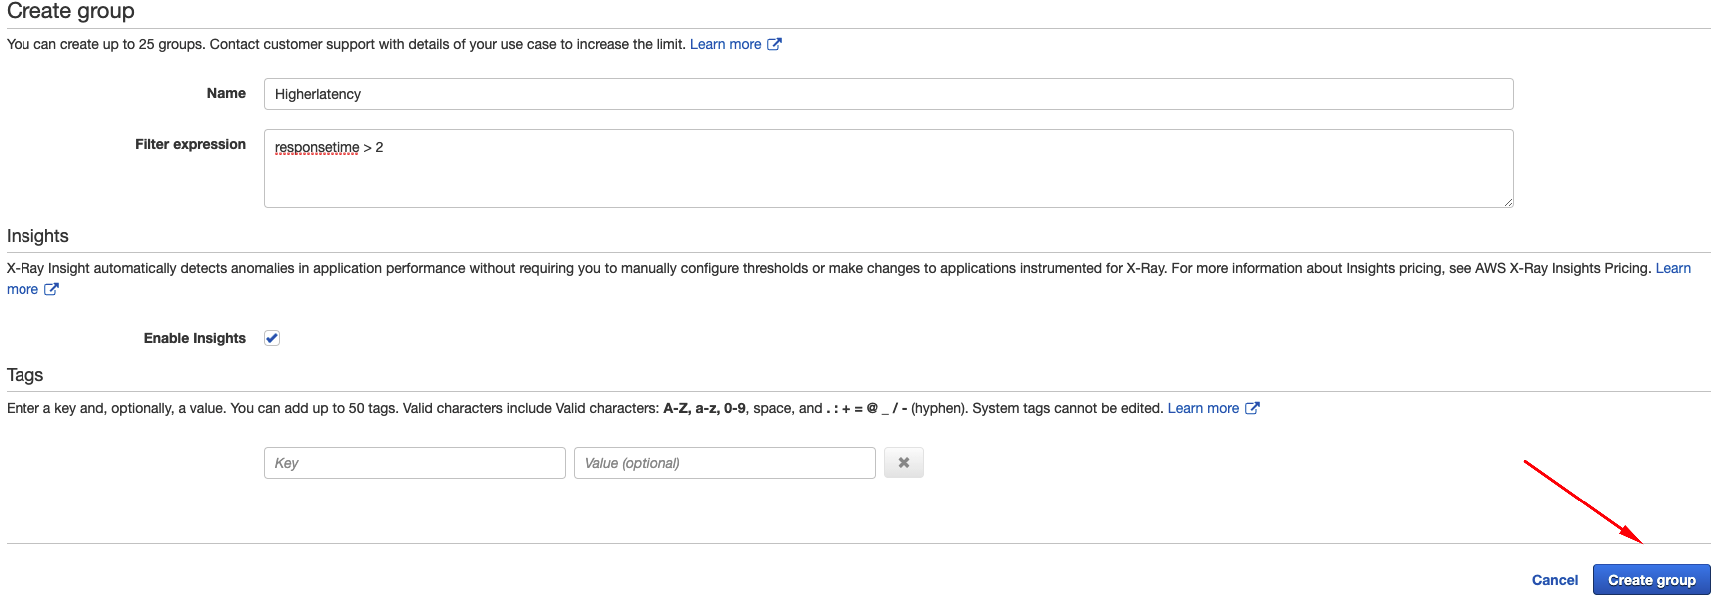
You can also create filter expressions using the custom annotations we created in the previous step, for example, grouping all failed requests by using the filter expression:
Annotation.Status = "FAILED"
-
(Optional) Allow some time (around 9~10 minutes) since your last API testing and invoke once again your API.
export ApiUrl=$(aws cloudformation describe-stacks --stack-name monitoring-app-tracing --output json | jq '.Stacks[].Outputs[] | select(.OutputKey=="ApiUrl") | .OutputValue' | sed -e 's/^"//' -e 's/"$//') echo "export ApiUrl="$ApiUrl curl -X GET $ApiUrl/items/ | jq -
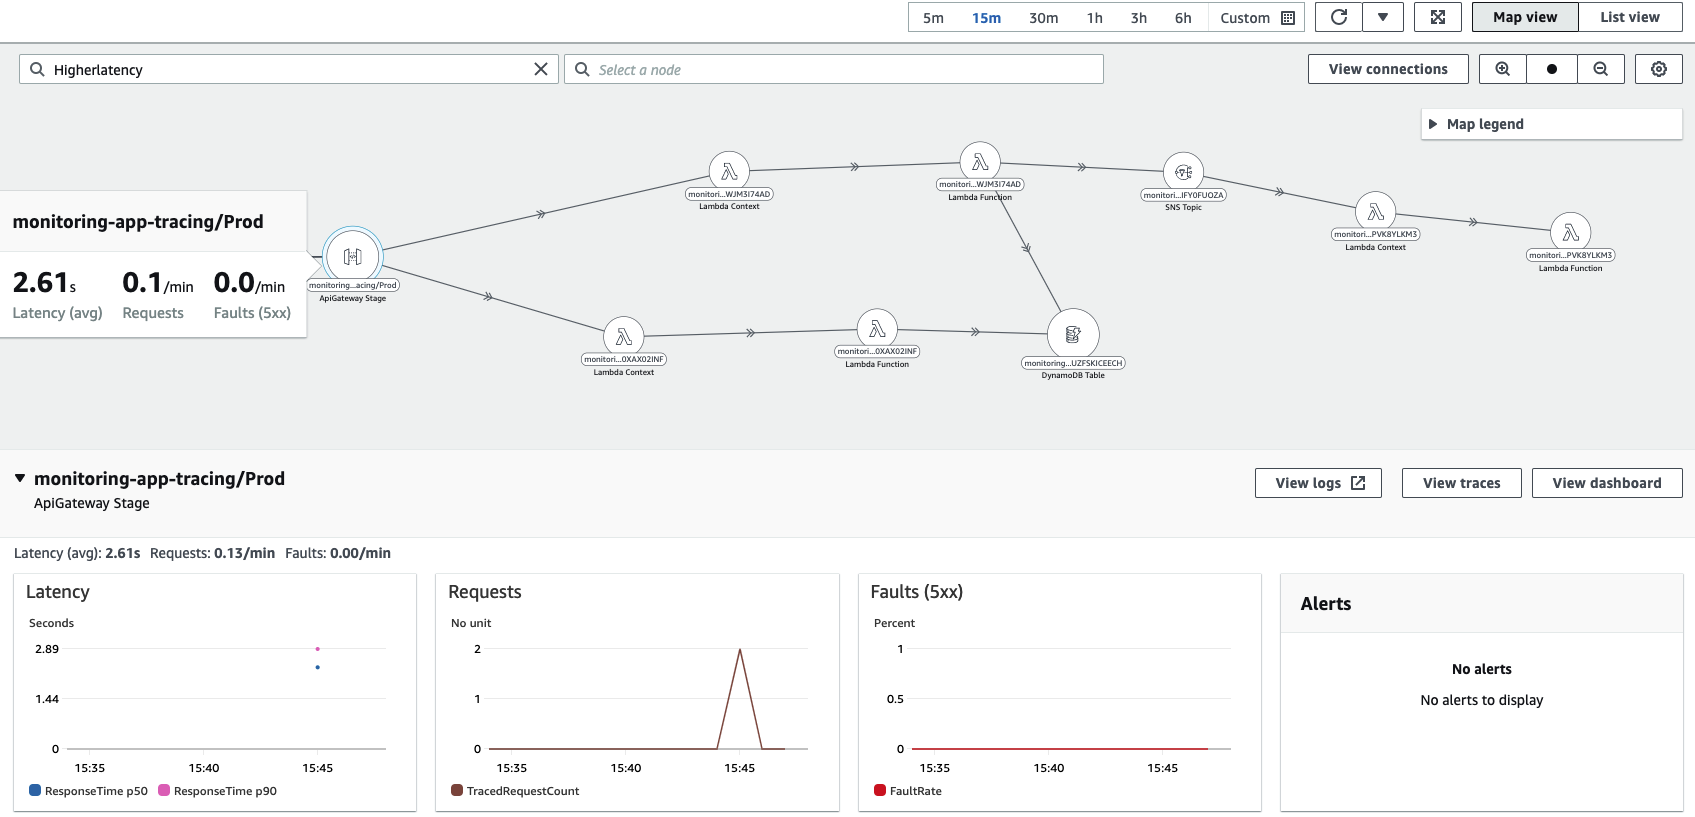
(Optional) Once created and selected, you will see that the Service Map changes to show only the services and routes that exhibit more than 2 seconds response time.
When a Group is created, X-Ray also publishes new metrics.
-
(Optional) Go to AWS XRay namespace on CloudWatch Metrics. Click on Group Metrics.
You will see a new metric called
ApproximateTraceCountcreated for the groupHigherlatencywhich you just created.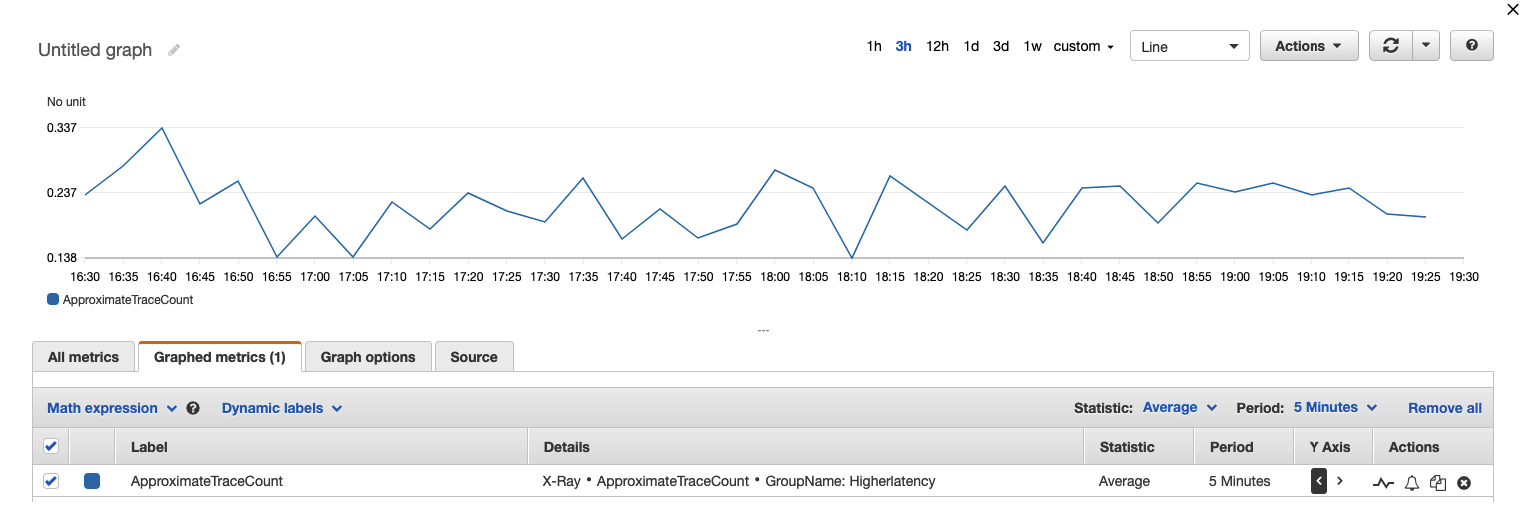
After creating a X-Ray Group, previous traces will be available on the Trace tab, but only new invocations will generate CloudWatch Metrics or be available in the Service Map screen.