Explore Metrics
Multi Function Visualization
Go to the Lambda Insights console.
Select the Multi-Function option. You can select the Lambda functions which are created by our application and look at their metrics.
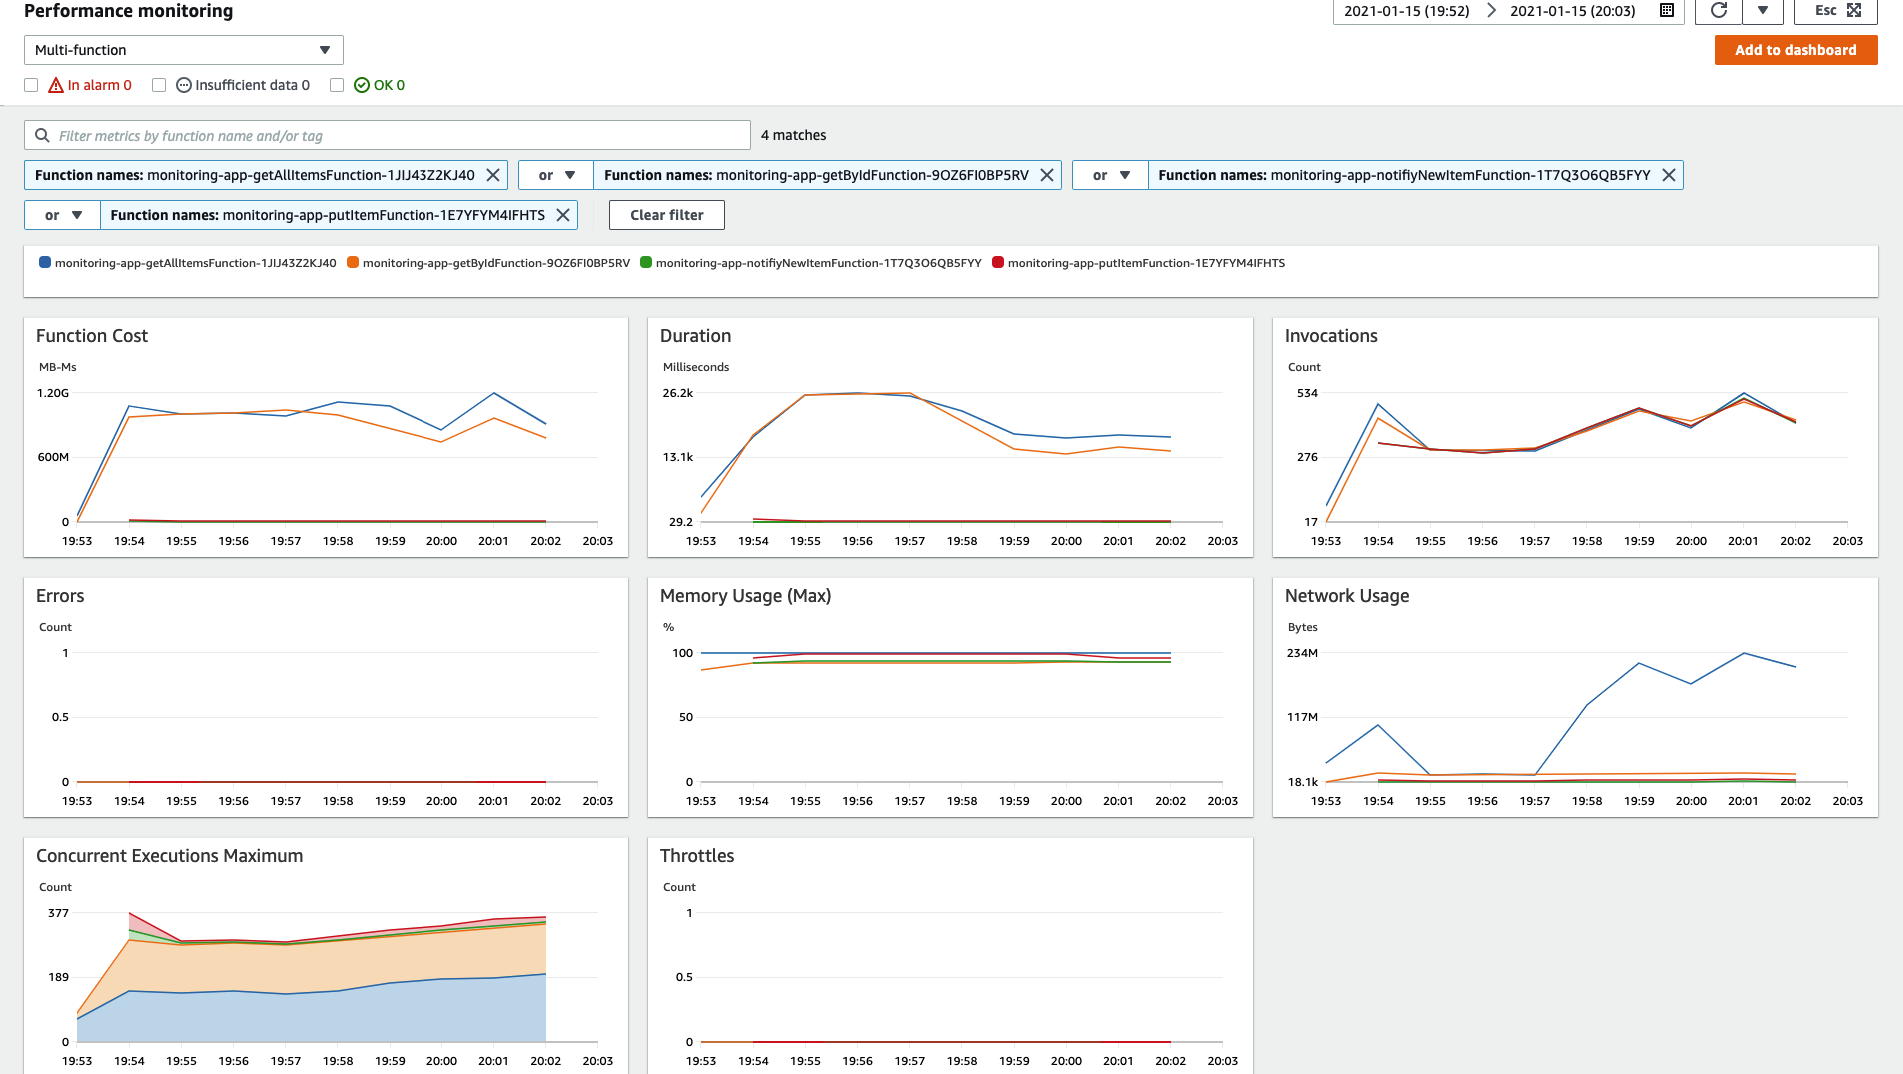
These metrics allow us to understand that all functions started with a relatively low response time and had them increased drastically and also had its Memory allocation at maximum during all the test. You can also note that even though the Duration for getItemByIdFunction and getAllItemsFunction are sky high, the duration for both putItemFunction and notifyNewItemFunction were steadily low and under an acceptable threshold, even with its memory consumption at maximum.
On the other hand, even though we experienced a higher error rate in the API Gateway responses, as shown by Locust output, not a single error has been reported by Lambda across the functions. This is because we are handling our exceptions inside our functions, thus being considered a successful execution.
We could try allocating more memory from 128MB to 1GB to our functions and see what happens, but would it really solve our issue considering the putItemFunction performed well under the same memory allocation?
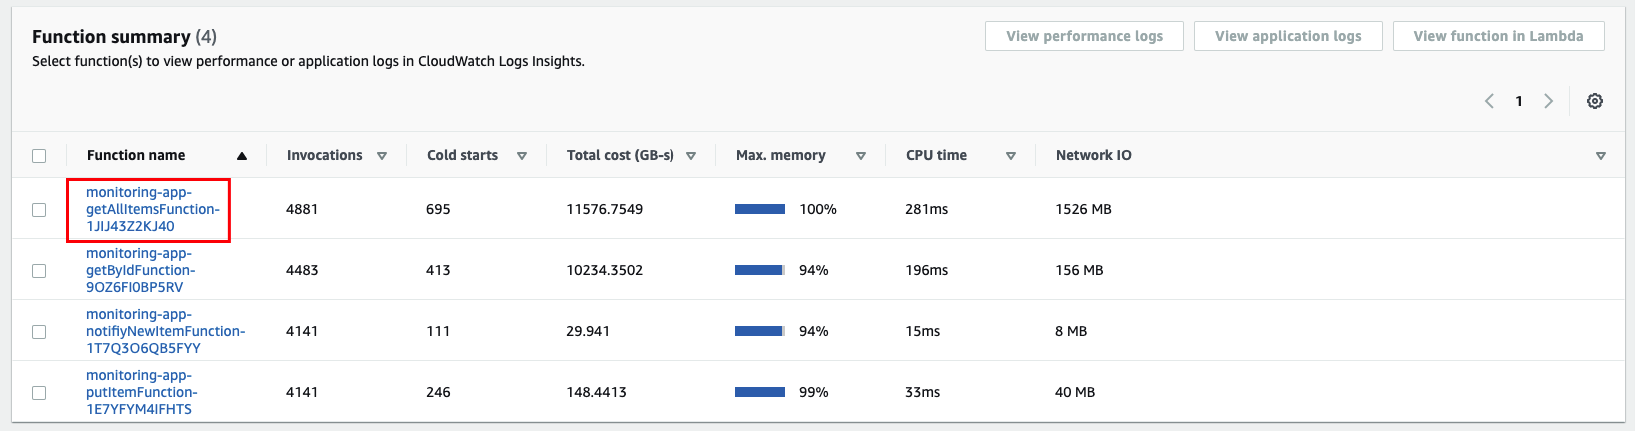
Click the monitoring-app-getAllItemsFunction function to analyze.
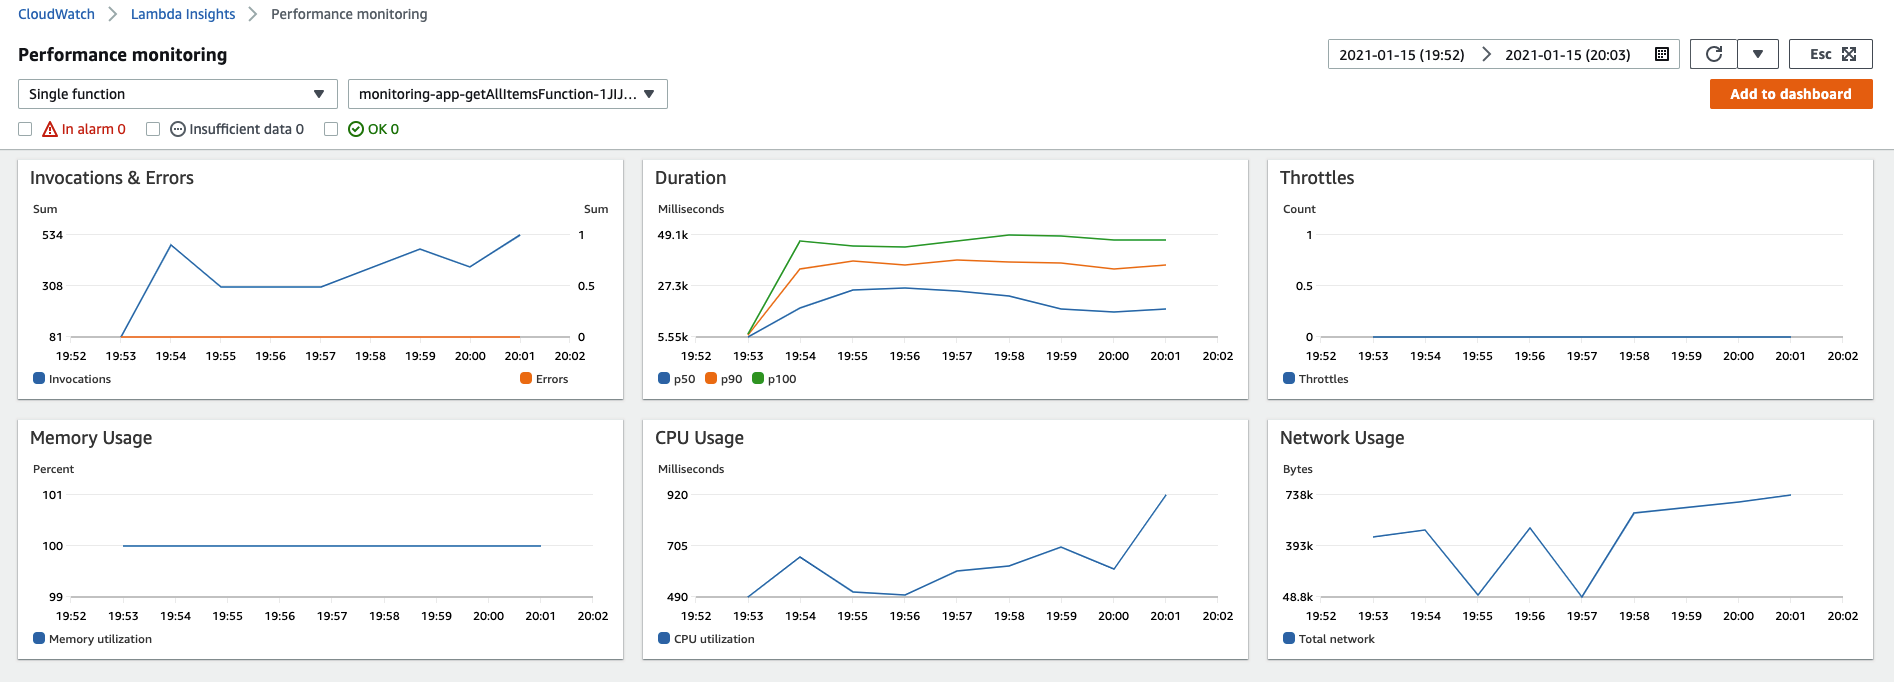
Single Function Visualization
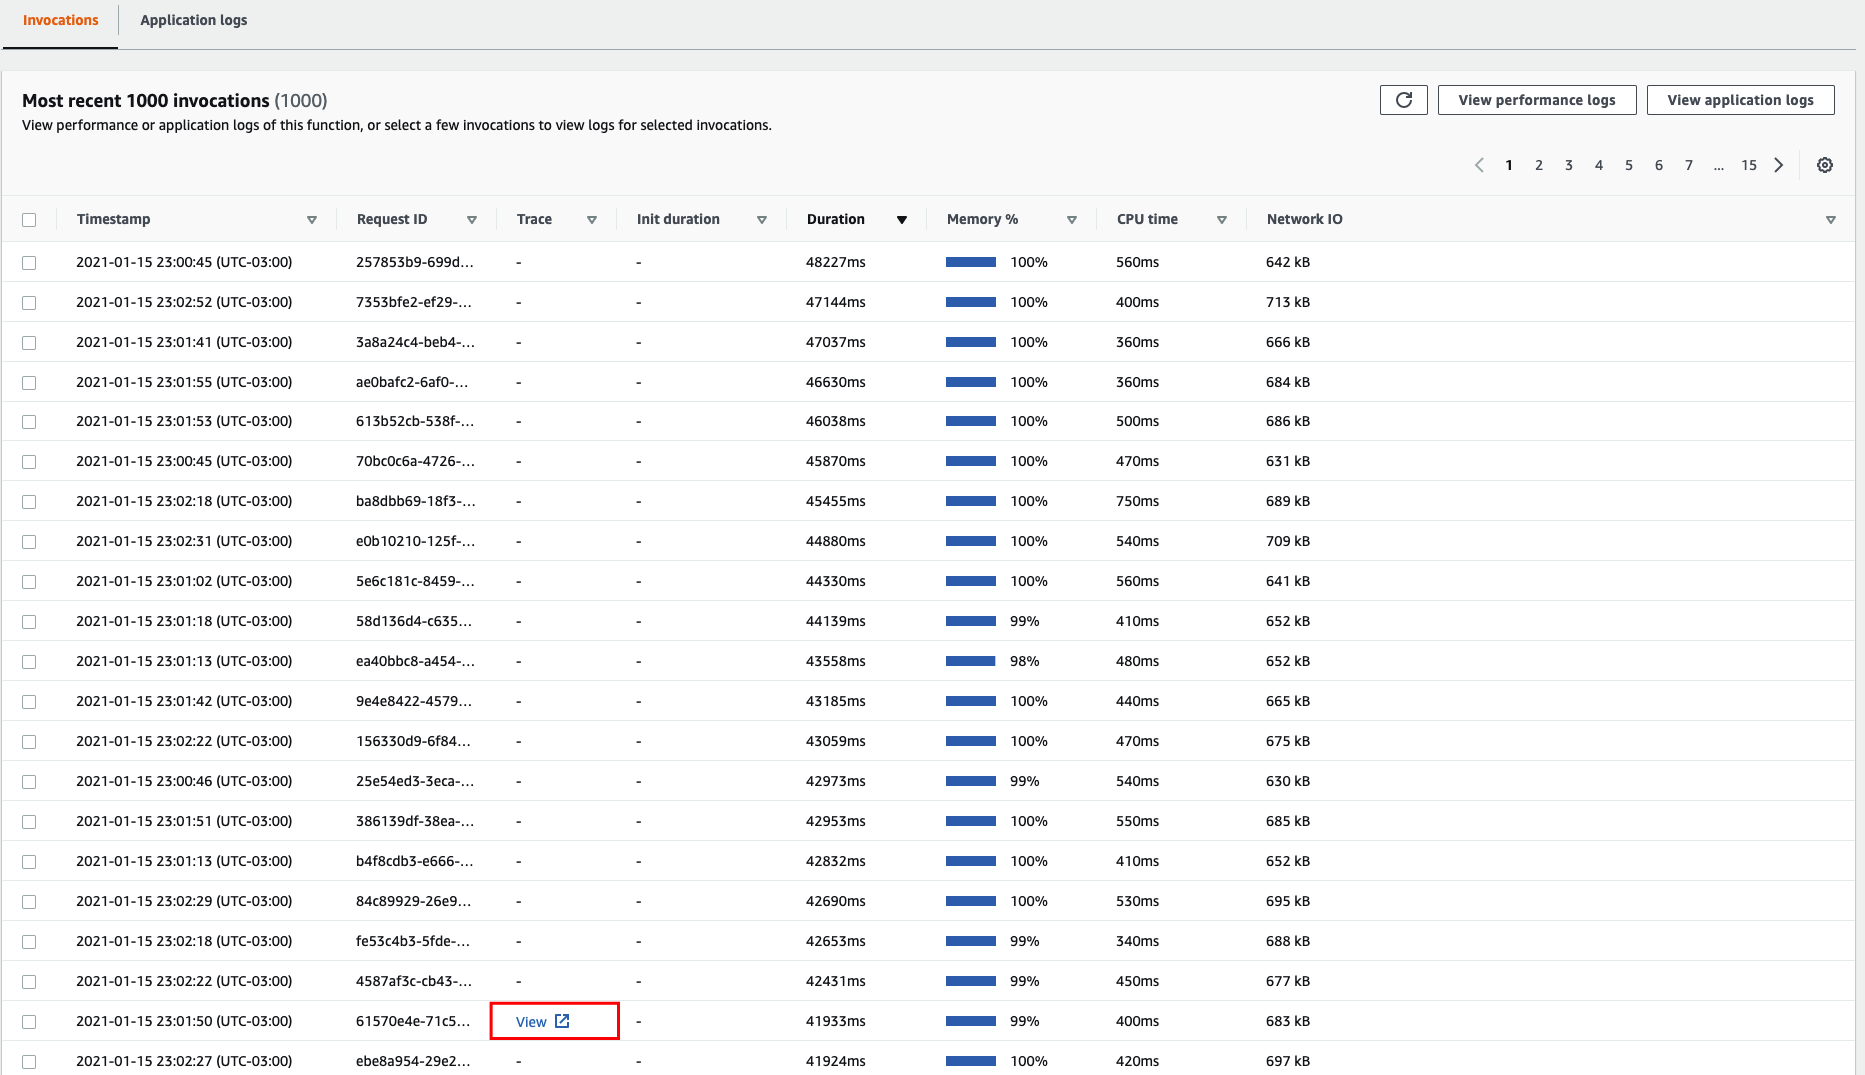
Lambda Insights is integrated with ServiceLens. You can view AWS X-Ray traces by clicking on View shown below for a particular function execution that has been sampled by AWS X-Ray. In case you have gone through the Distributed Tracing module, click on one of the available Traces to dig even further.
Bonus Round
This step requires you to go through the Distributed Tracing module. In case you haven’t done it, it’s still worth reading through the example.
ServiceLens and X-Ray Integration
By selecting a specific Trace from the previous step, you will go directly into ServiceLens Service Map console to navigate through all trace’s nodes. That makes easier for us to understand that the problem is ocurring inside Amazon DynamoDB, which is throttling our request.
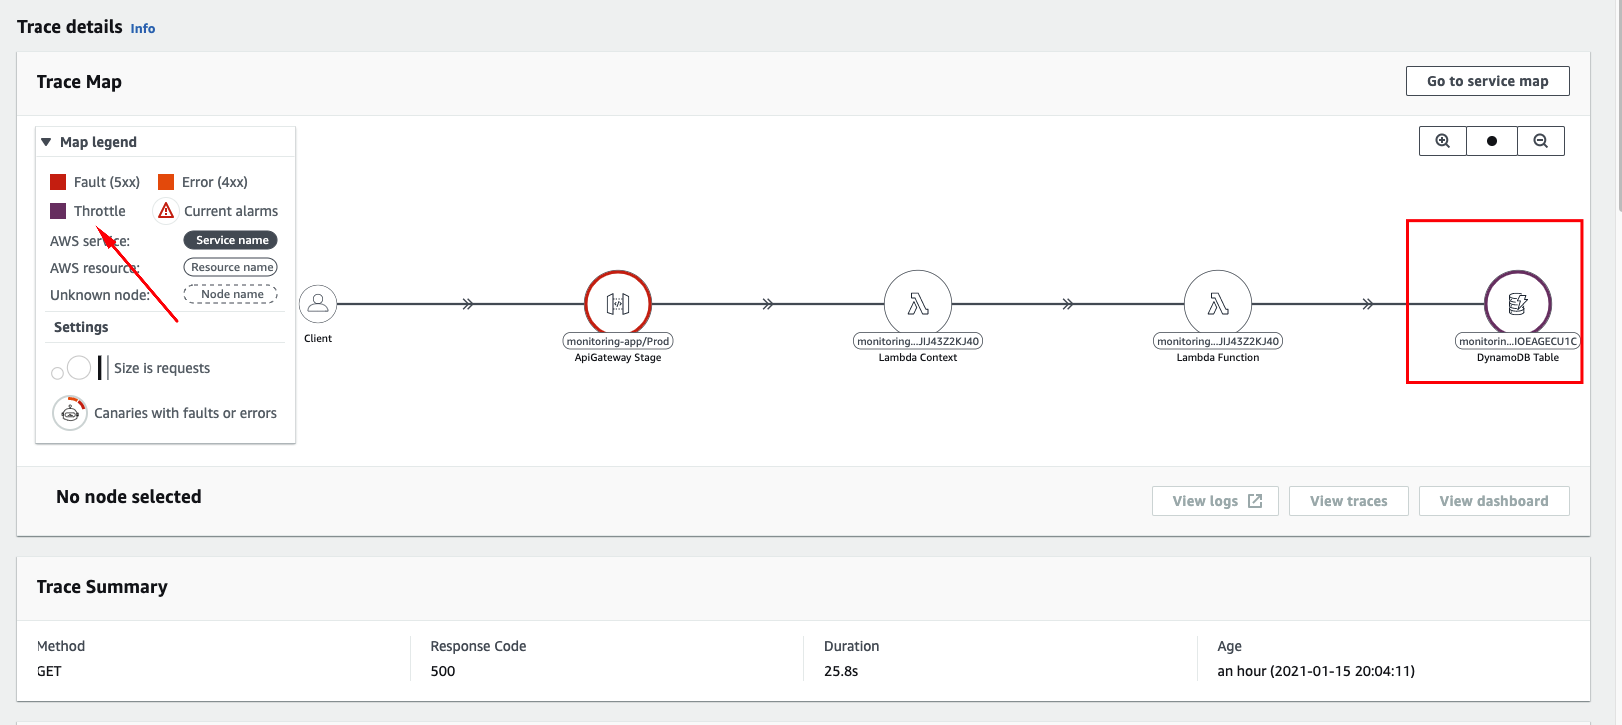
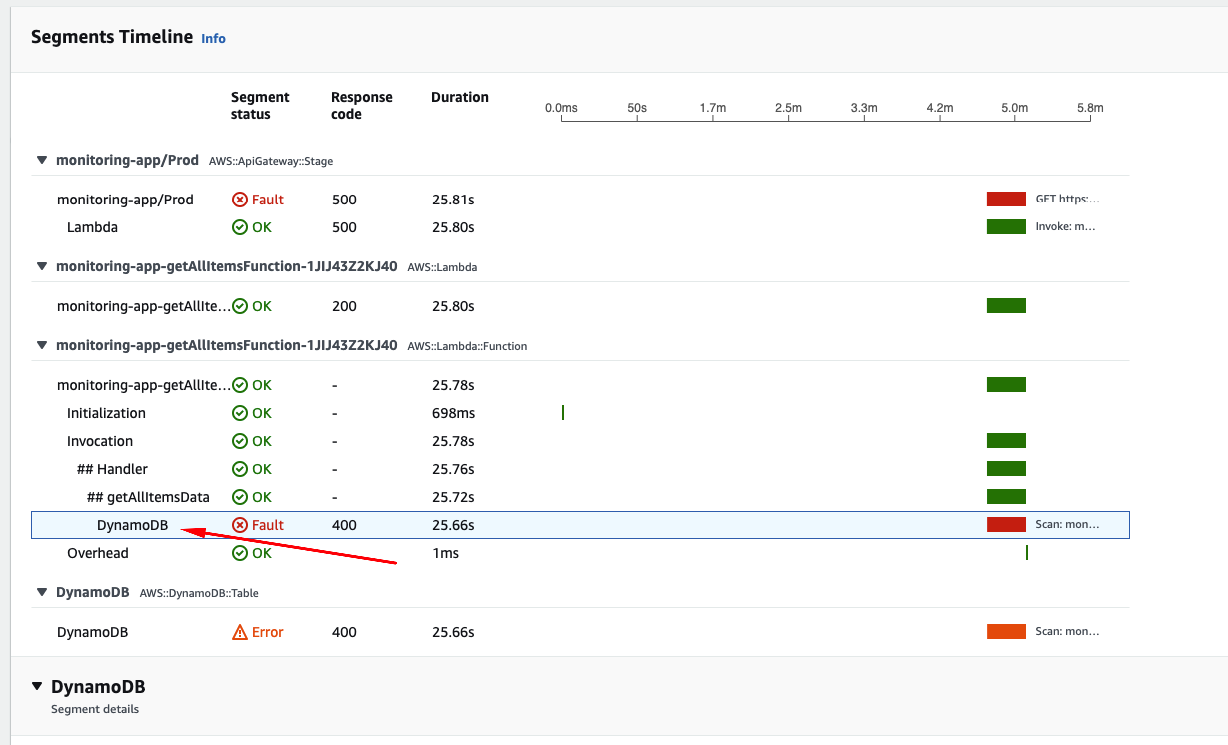
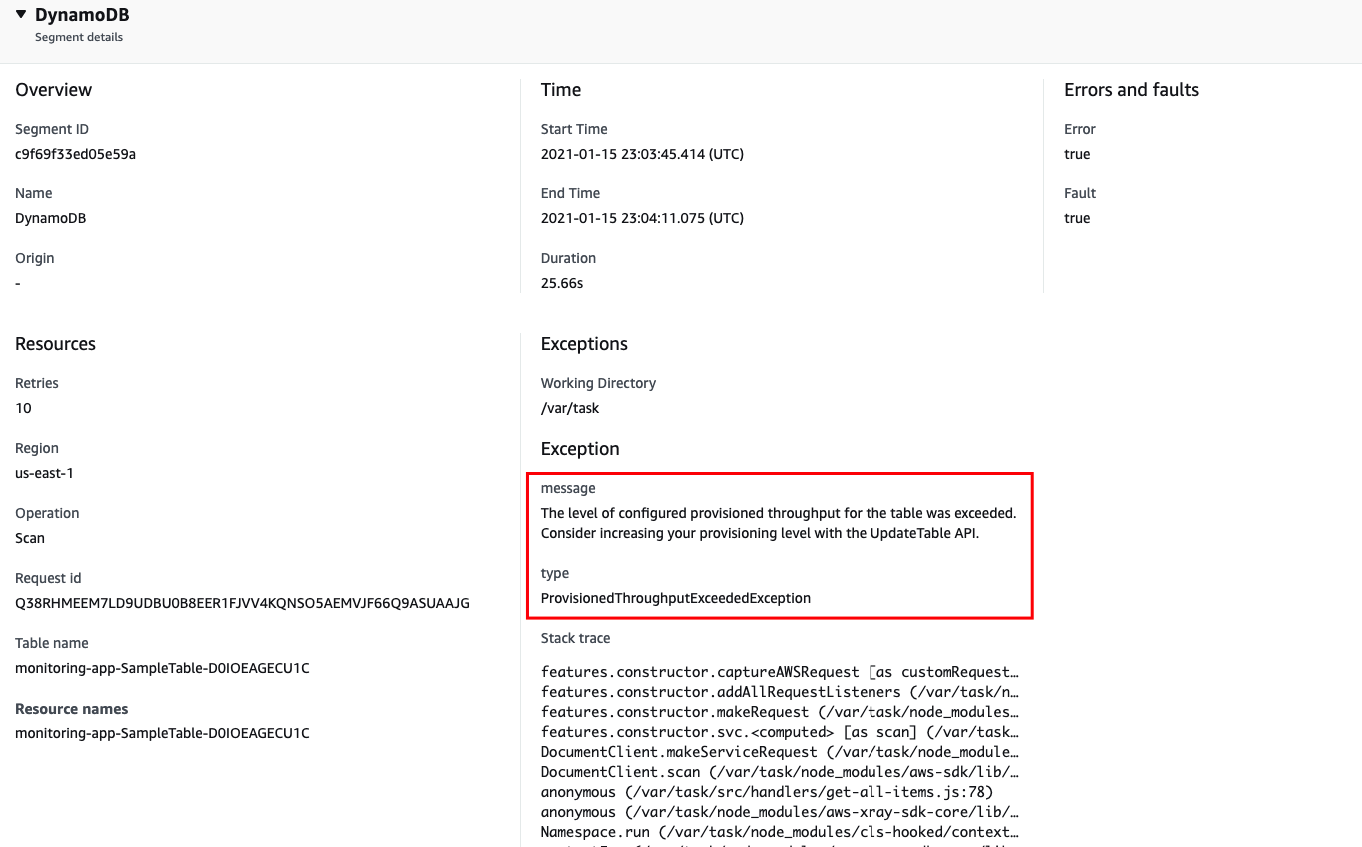
Now its clear to us that the biggest offender is within our DynamoDB table design. As the load test progresses, we are flooding our table with items while still performing a Scan operation to the same table, making it a more complex and costly operation, since we designed our application code and table following a naive approach, without Indexes or Query Result Pagination.
You can now understand that simply increasing the memory allocation to our functions from 128MB to 1GB (or even 3GB) could bring a small benefit at the very beginning, but ultimately we’d run into the same ProvisionedThroughputExceededException, leading us to rethink the way we designed our table and fetch its items.
This is just one of the many examples where not only Lambda Insights, but also implementing the proper business and operation metrics and distributed tracing can really ease your job during troubleshooting tasks, be it for performance bottlenecks or any kind of service disruptions.